Get in Touch with Saiweiglass



The absorption spectrum of glass demonstrates how strongly a glass material absorbs light at each wavelength. To read it correctly, the vertical-axis quantity and the sample thickness and measurement geometry must be identified. A decrease in transmitted light can be due to absorption, surface reflection, and/or scattering of the light away from the detector.
Updated November 2026
A clear cover can pass the visible spectrum while absorbing the band used by a sensor. This guide shows how to interpret these differences and diagnose low readings, and how to define an optical stack.
What the absorption spectrum of glass shows
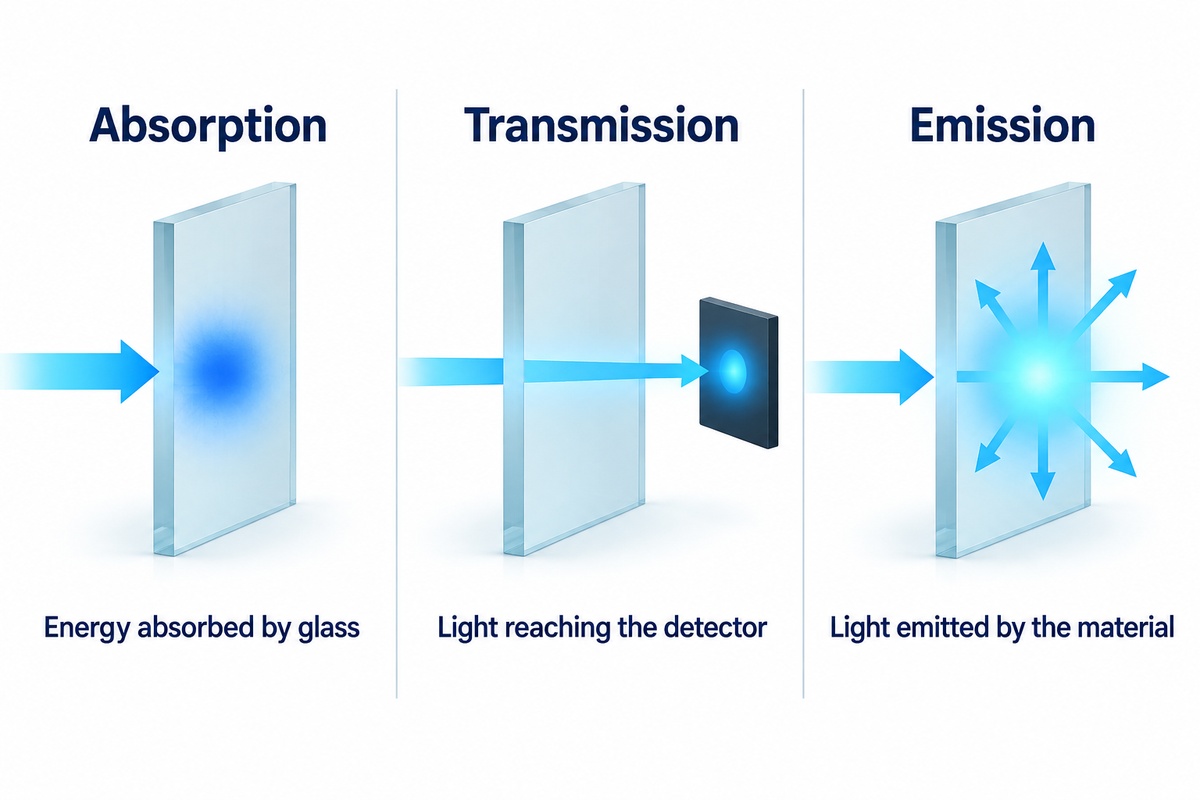
Optical absorption spectra explain the behavior of light as it interacts with various samples across a wavelength range. Their vertical axis can plot logarithmic absorbance, an absorption coefficient or the fraction of incident power absorbed. Those quantities answer different questions, so the axis label matters as much as the curve’s shape.
Absorptance: Ratio of absorbed to incident radiant power.
Think of the curve as representing the wavelengths at which the sample absorbs light energy. An absorbed photon can excite an electron into a higher energy state. Vibrations also absorb energy, particularly in the infrared. These processes lead to the presence of absorption bands and edges.
- Peaks on an absorbance plot: stronger attenuation at the stated wavelengths.
- Dips on a transmission plot: Less light reaches the detector. The reason for the dip needs to be identified.
- Emission spectra: Light emitted by the material rather than light removed from an incident beam.
White light contains many wavelengths and may change color after passing through glass. However, the human eye is unable to see how much light passes through the ultraviolet or infrared. The corresponding guide to how glass redirects and scatters light describes possible paths that light can take through an optical component.
Reading absorption spectra: absorbance, transmittance and reflection
Absorbance is a logarithm; absorptance is an absorbed-power fraction. Transmittance describes the fraction of power that passes through the sample, and reflectance describes the fraction that’s returned. When comparing curves, align the definitions of the terms and their reference conditions first; identical-looking axis numbers can describe quite different optical properties.
| Quantity | What it measures | Units or reporting basis |
|---|---|---|
| Absorptance | Absorbed power / incident power | Fraction or % |
| Decadic absorbance | A10 = −log10(T) | Dimensionless; declared reference |
| Napierian absorbance | Ae = −ln(T) | Dimensionless; natural logarithm |
| Internal transmission | Transmission within the material | Fraction or %; interfaces separated |
| Regular transmittance | Light collected along the direct beam | Fraction or %; detector aperture stated |
| Total transmittance | Direct plus diffusely transmitted light | Fraction or %; hemispherical collection |
| Regular reflectance | Specularly reflected light | Fraction or %; incidence stated |
| Total reflectance | Specular plus diffusely reflected light | Fraction or %; hemispherical collection |
| Absorption coefficient | Bulk attenuation per optical path length | cm−1 or m−1; logarithm convention stated |
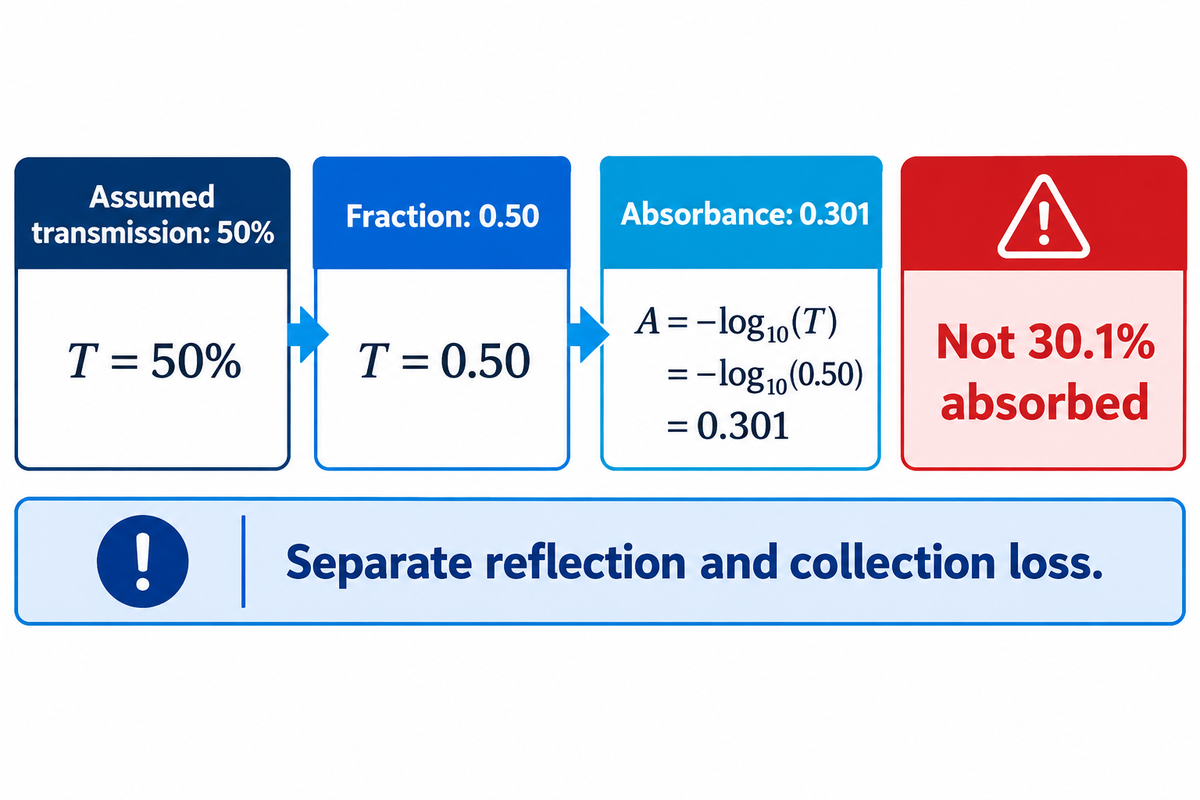
Suppose a scan reports 50% transmission at the wavelength of interest: the intensity of the light reaching the detector is half the reference value. Convert this percentage to the fraction 0.50, and compute A10 = – log10(0.50) = 0.301. Keep in mind that this value represents a logarithmic reading, and doesn’t imply that the glass absorbed 30.1% of the incident light.
Optical density is another name commonly used for absorbance, but isn’t related to mass density. It’s essential to separate the interface contribution and the detector’s collection loss before interpreting this result. The IUPAC absorbance definition distinguishes the logarithmic quantity from attenuation that includes scattering.
UV and infrared absorption: why wavelength matters
Glass absorbs different wavelength bands in different ways. Electronic transitions dominate the short-wavelength absorption edge, while vibrations and hydroxyl groups affect infrared absorption. Composition and thickness determine the useful window, so a material that looks colorless can still have high absorption in a sensor’s operating band.
Can UVB go through glass?
Yes, suitable UV-grade fused silica allows UVB to pass through. Ordinary window glass strongly attenuates this region. Judge an optical component by its measured curve across the actual source band rather than its visible light transparency.
Impurities and intentional dopants can also affect UV absorption. More detail on this subject can be found in the guide on quartz and fused-silica grades.
Why can’t infrared pass through glass?
Some infrared can pass through glass. Many common silicate glasses transmit part of the near-infrared and strongly absorb at longer wavelengths. Hydroxyl content and the glass network shape the absorption band, which is why a visible-light window and a thermal-imaging window require different material choices.
SCHOTT’s TIE-35 describes a small OH-related feature around 1450 nm and a main band typically between 2.9 µm and 4.2 µm in its optical-glass discussion. The cited technical note is the November 2020 version. Those are absorption features, not guaranteed pass-band endpoints for every grade.
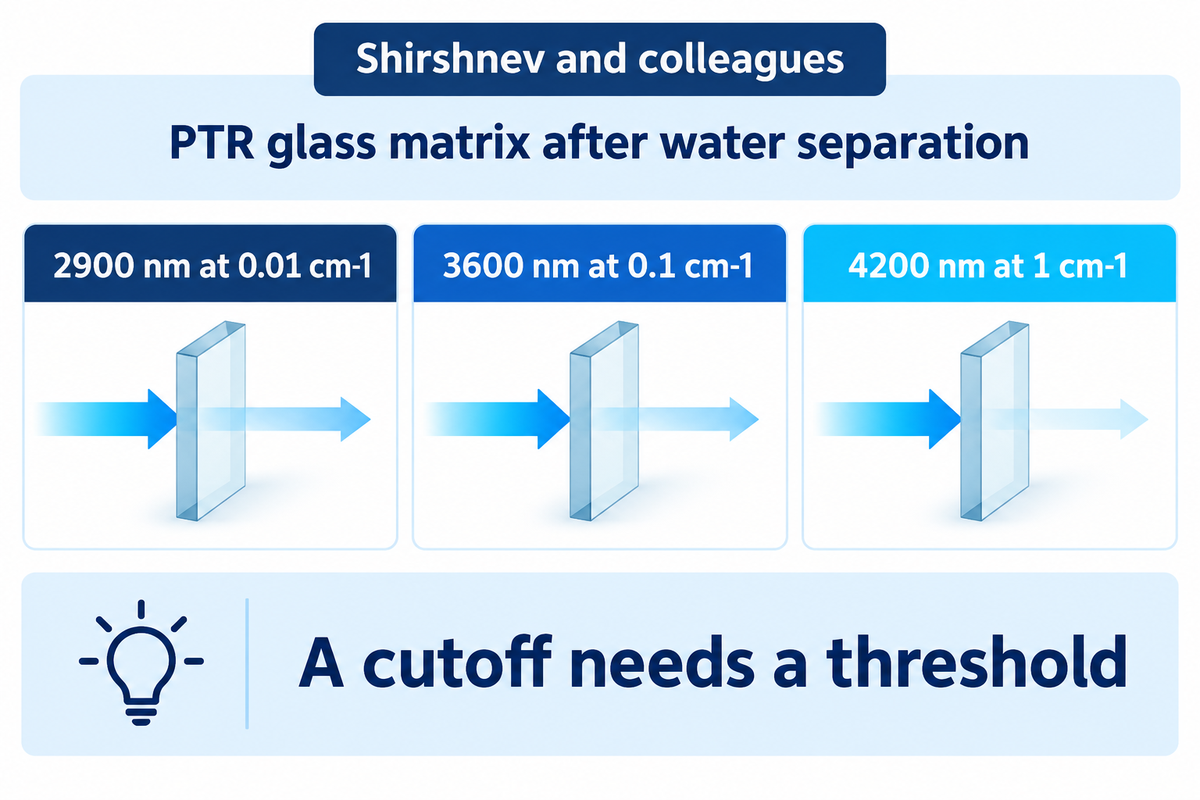
A cutoff needs a threshold. In Shirshnev and colleagues’ photothermorefractive-glass study, the reported long-wavelength edge was 2900 nm at a decimal absorption coefficient of 0.01 cm−1. It became 3600 nm at 0.1 cm−1 and 4200 nm at 1 cm−1.
These thresholds describe the glass matrix after the study separated water-related absorption. The material didn’t acquire three different spectra; the authors applied three different thresholds.
How thickness, composition and coatings change glass properties
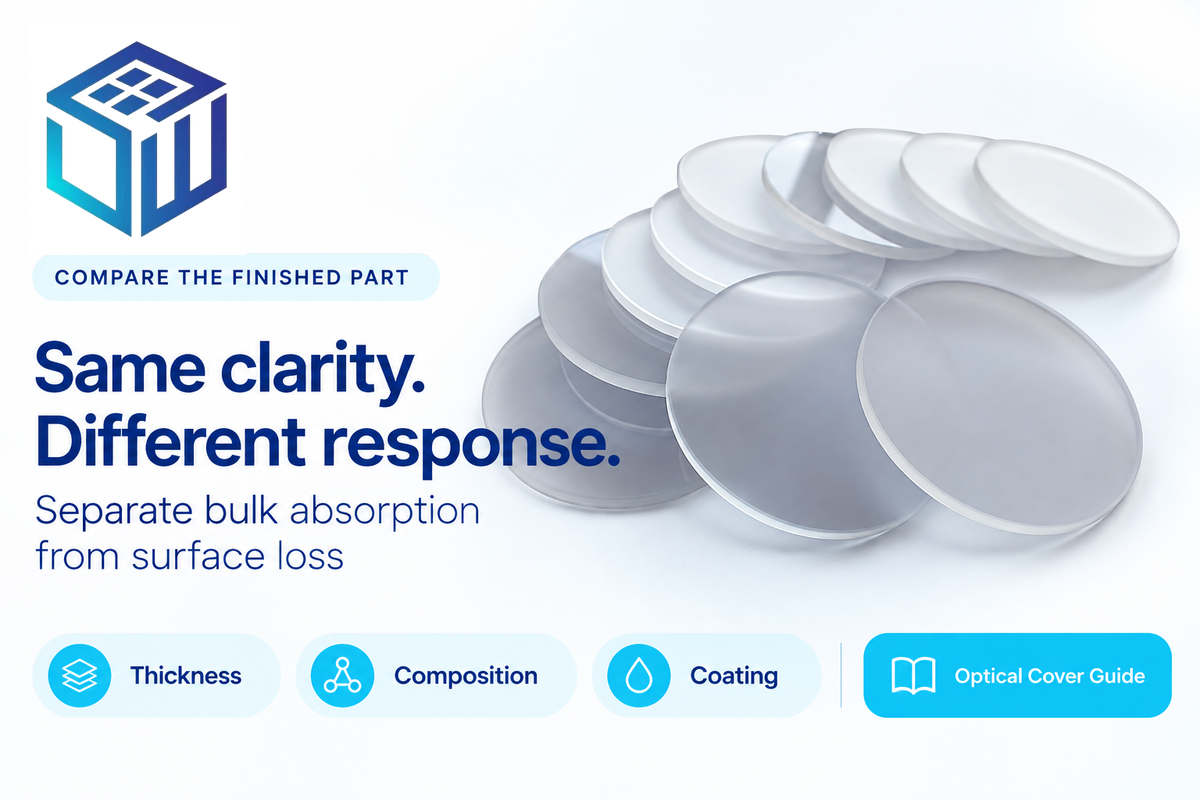
Greater thickness lengthens the path through absorbing material; chemical composition changes the absorbing species; coatings change the interface response. Compare these properties of glass separately. A thinner coated part may transmit more light even when its underlying glass material has the same bulk absorption coefficient.
Internal transmission in homogeneous materials at a fixed wavelength obeys exponential thickness scaling: Ti(d2) = [Ti(d1)]^(d2/d1). The caret means “raised to the power of”; surface reflection is neglected. The BK7 transmission and thickness guide applies these principles to a named optical glass. Transmittance can be reported as a fraction (0 to 1) or a percentage (0 % to 100 %); convert percentages to fractions before using the formula.
Select a thickness by taking the measured internal transmittance Tref at your operating wavelength, and the reference thickness dref. With 0 < Tref < 1 and a required minimum 0 < Tmin < 1, the largest allowed optical path is dlimit = dref × ln(Tmin) / ln(Tref). Choose a thickness less than or equal to this limit, and verify mechanical requirements. Add the coating and interface losses to the light budget of the finished part.
- Soda-lime glass is appropriate for visible-light windows; ordinary clear float attenuates UVB and doesn’t make a good long-wave thermal-imaging window.
- Low-iron glass has improved visible clarity and less green tint. Pilkington describes Optiwhite as transmitting more visible light than clear float.
- Borosilicate is grade dependent: SCHOTT describes BOROFLOAT 33 as highly transparent in visible, near-infrared and ultraviolet regions. Its UV curves change with thickness; its thermal expansion and mechanical properties address different requirements.
- Suitable UV-grade fused silica transmits UVB and visible light, with useful near-infrared transmission. Thorlabs lists its uncoated UV-fused-silica round windows for 185 nm to 2.1 µm; select the specific grade for longer wavelengths and OH-sensitive bands.
For an absorbing filter, a dopant’s absorption band can be the required function. Researchers dope glass matrices to change optical absorption, connecting an ion’s local environment with an observed absorption feature and an optical energy band gap. Increased copper related absorption was attributed to the absorption of ions in octahedral coordination, in the published figure context for Çolak and Aral’s phosphate glass study.
The absorption spectra of these glasses map the studied glasses’ response to dopant content, helping explain why useful filter absorption would be a loss in a clear viewing window. The authors discuss phosphate compositions’ unique physical properties, including high thermal expansion and low melting and softening temperatures. These processing traits and the glass transition temperature belong in material selection alongside the optical response.
Indices of refraction describe how light travels through an optical material. Refractive index compares the speed of light in a vacuum with phase velocity in the material. A higher index of refraction is not itself an absorption measurement; dispersion describes how the index changes with wavelength.
For glasses with different formulations, both refraction and absorption must be compared. A higher refractive index changes phase velocity, while the absorption curve locates the energy loss. Different glasses can consequently look equally clear yet function differently in a sensor band. Coated parts also require their ‘finished-stack’ response; see how anti-reflective coatings reduce surface loss.
One practical mismatch appears on Edmund’s #84-476 page: the selected part is 2.00 ±0.38 mm thick, while a displayed family curve uses a 3 mm specimen. Match the figure’s sample description to the part being ordered.
Measuring optical glass with a spectrophotometer
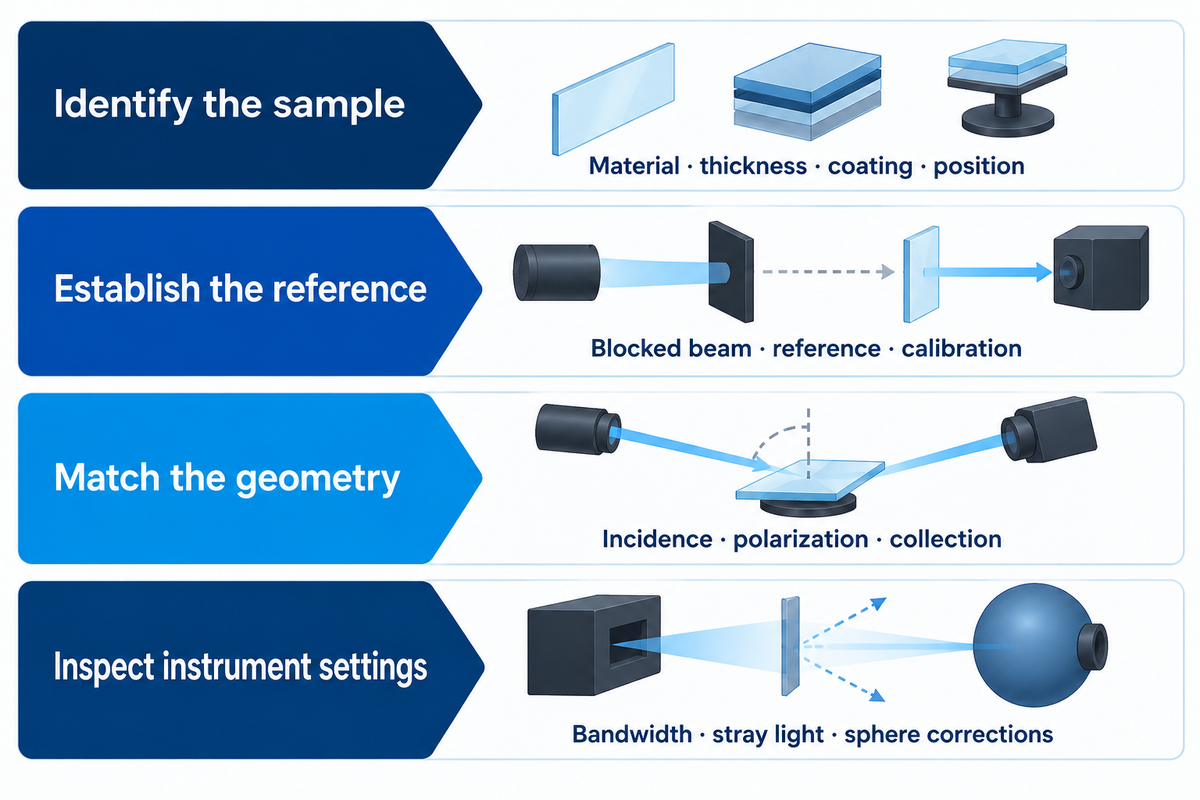
Measure transmission and reflection with collection geometry suited to the sample, then correct for the instrument and interfaces before assigning bulk absorption. A direct-beam spectrophotometer is useful for clear, regular transmission. A scattering surface also requires total collection. Check the response of the integrating sphere.
How is an absorption spectrum measured?
A spectrophotometer compares the light reaching its detector with a reference across the chosen wavelengths. UV-visible and FTIR instruments cover different spectral regions. Define the specimen, reference, bandwidth and geometry, and state the measured quantity explicitly. To derive substrate absorption, it’s to be determined whether the attenuation is due to reflection and/or scattering.
- Identify the sample. Record material, thickness, coating, face orientation and measurement position.
- Establish the reference. Check the blocked-beam and reference readings, detector response and wavelength calibration.
- Match the geometry. Specify incidence, polarization and direct or total collection.
- Inspect the instrument settings. Retain spectral bandwidth, stray-light checks and sphere corrections with the curve.
ISO 15368:2021 addresses regular transmittance and reflectance of plane optical elements. For diffuse collection, define the sphere method separately. NIST’s fused-silica diffuser comparison examines both directional scattering and hemispherical measurements.
Robertson’s published measurement study compared the same didymium glass at 2.5 nm and 10 nm instrument bandwidths. With the wider setting, minima broadened, some shifted, and some close pairs merged. The sample hadn’t changed; the instrument averaged its response over a wider interval.
For a supplier comparison, this result offers a specific diagnostic step: align bandwidth settings before interpreting a shifted absorption edge as a composition change. Stray light refers to unwanted light that reaches the detector from a different path or a different wavelength. Neutral density filters can be used to check photometric response, but their spectral behavior and calibration must be considered. These ideas are from the original transmission spectrophotometry study.
Record the measurement temperature: a curve measured at room temperature describes transmission at that temperature. Shirshnev and colleagues’ PTR study used 8 mm specimens for 250–2700 nm and 1 mm specimens for 2700–4700 nm, so the optical path differed across the spectrum.
In his 1972 paper, Mielenz estimated a potential variation of up to 3 × 10^−3 transmittance units for the particular spectrophotometer studied. The example used a 3 mm optical thickness, a 500 nm wavelength and a 0.8 nm bandwidth. It illustrates a geometry effect rather than indicating the capabilities of a modern instrument.
3-Loss Spectrum Check: diagnose a drop in transmission
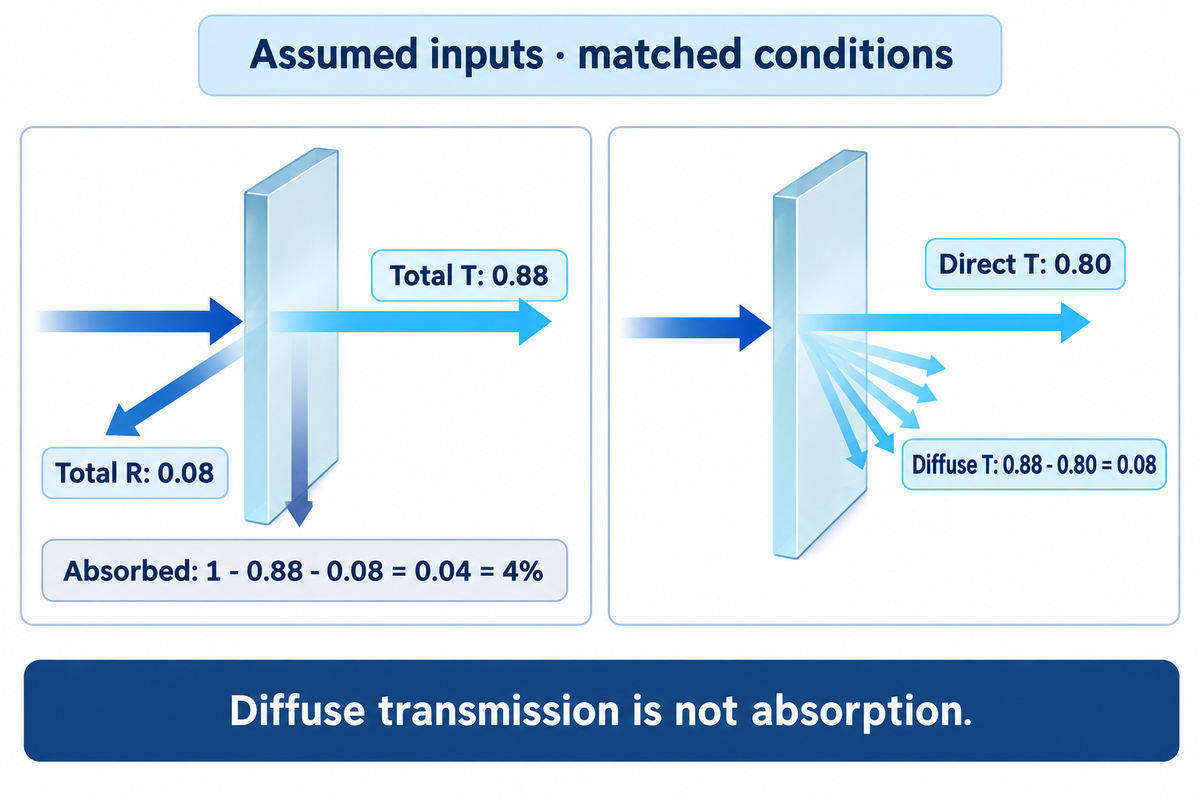
The 3-Loss Spectrum Check separates reflected light, scattered light, and absorbed light, after instrument conditions are matched. Start with the reported value, compare direct and total collection, and then compute the absorbed fraction from total transmission and reflection. This approach diagnoses a measurement before assigning a material cause.
Assumed inputs: total transmittance of a non-emitting sample is 0.88, and total reflectance is 0.08, both measured at the same wavelength. Both measurements cover their full hemispheres, are normalized the same way, and include the relevant measurement uncertainty. The absorbed fraction is 1 − 0.88 − 0.08 = 0.04 = 4%.
The difference, 0.88 − 0.80 = 0.08, is diffusely transmitted light. This example assumes direct transmittance of 0.80 measured under matched conditions. Counting this as absorption would overstate material heating. For a coated or bonded sample, this is true for the tested stack; separating the substrate contribution would take additional measurements. Small residuals require an uncertainty budget, because subtracting two large measured fractions can leave a poorly resolved result.
| Observed change | Candidate cause | Next measurement or check |
|---|---|---|
| Direct T falls; total T holds | More forward scattering | Compare diffuse transmitted fraction |
| T falls while R rises | Changed interface response | Compare matched total T and R |
| T + R falls | Absorption or collection error | Check sphere corrections and uncertainty |
| A narrow dip broadens | Wider instrument bandwidth | Repeat at the same bandwidth |
| A blocked beam reads above zero | Stray light or offset | Check dark/reference behavior |
| Reading changes with sample position | Local nonuniformity or beam displacement | Map the same measurement area |
| Reading changes after tilting | Incidence and polarization effects | Restore the specified beam geometry |
| Thicker specimen transmits less | Longer absorbing path | Compare corrected internal transmission |
| Bonded assembly differs from bare glass | Additional layers or interfaces | Measure the assembled optical path |
Integrating spheres can have various faults, too. Nilsson and colleagues’ study of sphere error suggests checking the collection system if you see all the missing light as absorbed energy.
Using the spectrum in outdoor and marine cover glass

When designing optical covers for an outdoor or marine display, evaluate the finished stack in the wavelengths used by the display and its sensors. Visible brightness, reflected glare and sensor throughput are different requirements. A low absorption substrate helps only when its coating, print and bond layers also suit the optical path.
- Display viewing area: compare spectral throughput and glare behavior under the intended illumination.
- Sensor aperture: use the emitter and detector bands, including the coating and adhesive in that area.
- Printed border: distinguish an intentionally opaque region from the clear viewing window.
- Bonded stack: test the representative assembly instead of substituting a bare-glass curve.
CIE chromaticity details color appearance for a given illuminant and observer. It does not replace wavelength-by-wavelength measurements for a narrow-band sensor. Likewise, mechanical strength and thermal expansion should be aligned with optical parameters in a drawing, rather than be inferred from transparency.
SW Glass describes cover-glass processing, coatings, touch sensors and optical bonding for these applications. Its AR-coated cover glass is a candidate for the optical stack along with a touch sensor and bonding layers. The equipment designer specifies the complete enclosure and system tests.
What low-absorption glass costs
A stock fused-silica window is a good price benchmark: Edmund Optics listed #84-476 at USD 120 each for quantities of 1-5 on November 17, 2026. It’s a 25 × 25 mm UV-VIS-coated part, not a custom display cover. The price must be quoted with the dimensions, coating and order quantity.
| Quantity | Listed unit price, USD |
|---|---|
| 1–5 | 120.00 |
| 6–25 | 95.50 |
| 26–49 | 89.50 |
The Edmund catalog specification gives a 250–700 nm coating range. Prices can change; freight and applicable taxes need separate costing.
Thorlabs WG41010R is a 25 × 36 mm, 1 mm uncoated window. Ordering simply “fused silica” would hide a different optical path, geometry and surface treatment. For a custom cover, separate the glass blank, machining, printing, coating and bonding and a spectral test in the quote.
Set a spectral acceptance specification
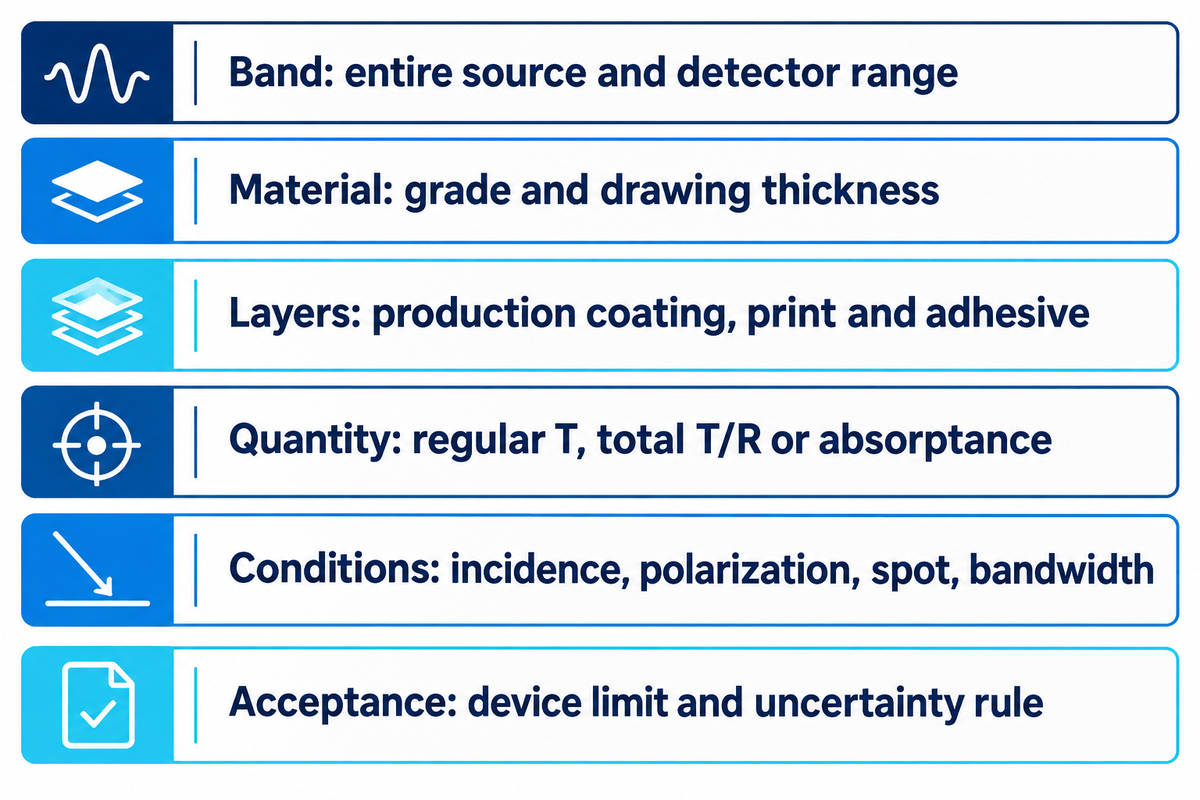
A spectral acceptance specification defines a sample, test and pass limit. Define the test in terms of source and detector band, then state if the requirement is for regular throughput, total throughput or absorptance. A minimum requirement and a typical catalog curve are different purchasing terms.
An RFQ prepared using the following fields connects the optical requirement to the test method. Define the device’s operating band and drawing dimensions, then specify transmittance values that meet the light budget. In laser systems, assess optical loss and absorbed power at the operating wavelength alongside visible clarity.
RFQ checklist — copy these into your quote request:
| Parameter | Recommended range | Why it matters | How to verify |
|---|---|---|---|
| Wavelength band | Entire source/detector band, stated in nm or µm | An average can hide a narrow dip | Supply wavelength-resolved results |
| Material and thickness | Named grade and drawing thickness in mm | Composition and path length change absorption | Match specimen and production drawing |
| Finished layers | Production coating, print and adhesive stack | Interfaces alter throughput | Identify test face and clear aperture |
| Measured quantity | Regular T, total T/R or derived absorptance | Collection losses need separate treatment | State method and reference |
| Instrument conditions | Matched incidence, polarization, spot and bandwidth | Settings can change the curve | Retain settings and calibration checks |
| Acceptance and uncertainty | Minimum, maximum or band-average limit defined by the device budget | Typical values are not acceptance limits | Agree uncertainty and pass/fail rule |
For a lower-loss component, establish how uncertainty is treated close to the acceptance limit. For a higher-absorption filter, establish the intended attenuation instead. Mielenz’s measurement analysis explains why the geometry of the beam and the sampled area belong in a reproducible comparison.
Frequently asked questions
What wavelengths are absorbed by glass?
Glass commonly absorbs ultraviolet radiation at wavelengths shorter than the visible band and longer-wavelength infrared radiation, while many clear grades transmit visible light.
Precise bands depend on the composition, thickness and impurities. Fused silica in a suitable UV grade can transmit UVB, while a doped phosphate composition can behave very differently. Read the curve for the named grade and specimen, then compare its useful transmission window with the source and detector wavelengths. Infrared performance can vary due to several factors including the presence of OH groups.
How would you know you were looking at an absorption spectrum?
Look for wavelength or photon energy on one axis and an absorption-related quantity on the other; the label should specify absorbance, absorptance or absorption coefficient.
A transmission curve runs in the opposite direction at an absorbing band. Before comparing its peaks with others, read and interpret its specimen thickness, units, and reference conditions. Logarithmic absorbance values and absorbed power curves use different vertical axes, so be sure to use the definition of the vertical axis of the curve even if two curves look similar.
Is glass just SiO2?
No. Pure silica has a predominant composition of silicon dioxide, but other oxides are also present in other glasses that alter processability and optical response.
Silicate formulations can include network modifiers, while phosphate glasses use a different network chemistry. Composition may be expressed in either mol or mass percent. When comparing formulations, the mol percent and mass percent reporting bases must remain distinct. Base a purchasing decision on the named grade and its measured spectrum; clear glasses are not interchangeable.
Does the absorption spectrum of glass change over time?
Yes, it can.
Irradiation, contamination or changes in surface layers can alter the measured response. Compare the same specimen conditions before and after exposure, separating a material change from cleaning residues, coating changes and instrument drift.
What is an absorption line spectrum?
An absorption line spectrum contains discrete narrow features where particular photon energies are removed from incident light, often associated with atomic transitions.
In a solid, broadened absorption bands are due to local variations in the environment, more commonly seen in glass.
Discuss the optical path in your cover assembly
Share your operating wavelength band, cover drawing and proposed coating or bonding stack with SW Glass. The outdoor and marine display components page describes the scope. The SW Glass fabrication team can use these to provide input on processing and a quote.
References & Sources
- Absorbance IUPAC Gold Book, 2025.
- Absorptance IUPAC Gold Book, 2025.
- Goniometric and hemispherical measurements of fused-silica diffusers Lemaillet et al., 2016.
- ISO 15368:2021: reflectance and transmittance measurement International Organization for Standardization.
- Standardization in Transmission Spectrophotometry A. R. Robertson, 1976.
- Physical Parameters in High-Accuracy Spectrophotometry K. D. Mielenz, 1972.
- Infrared absorption of photothermorefractive glass Shirshnev et al., 2021.
- Integrating-sphere errors in low-angle scattering measurements Nilsson et al., 2011; abstract.
- Accurate Transmission Measurements of Translucent Materials Alan Tirpak and Richard Young, 2008.