Get in Touch with Saiweiglass


Car Dashboard Screen: An OEM Engineering and Sourcing Guide

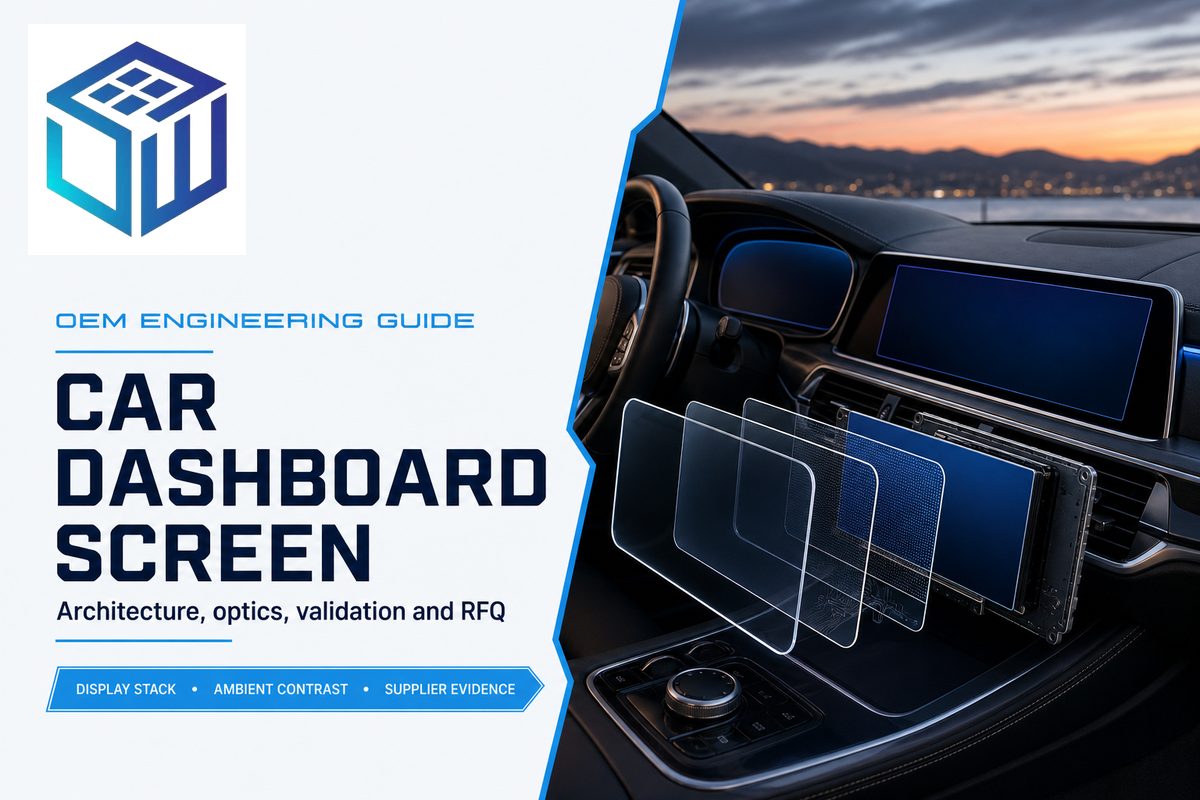
An in-vehicle display used for driver information, control, entertainment, and/or passenger functions is called a car dashboard screen. While determining the screen size and the peak brightness is certainly important in selecting a display for human-machine-interface applications, for an OEM program many other display requirements need to be defined, architected, and integrated prior to the selection of a display. These include defining the role of the car display, selecting the display architecture, designing the optical stack, and verifying the display assembly under various environment stresses and conditions.
Map the Dashboard Screen by Driver Task, Not Marketing Name
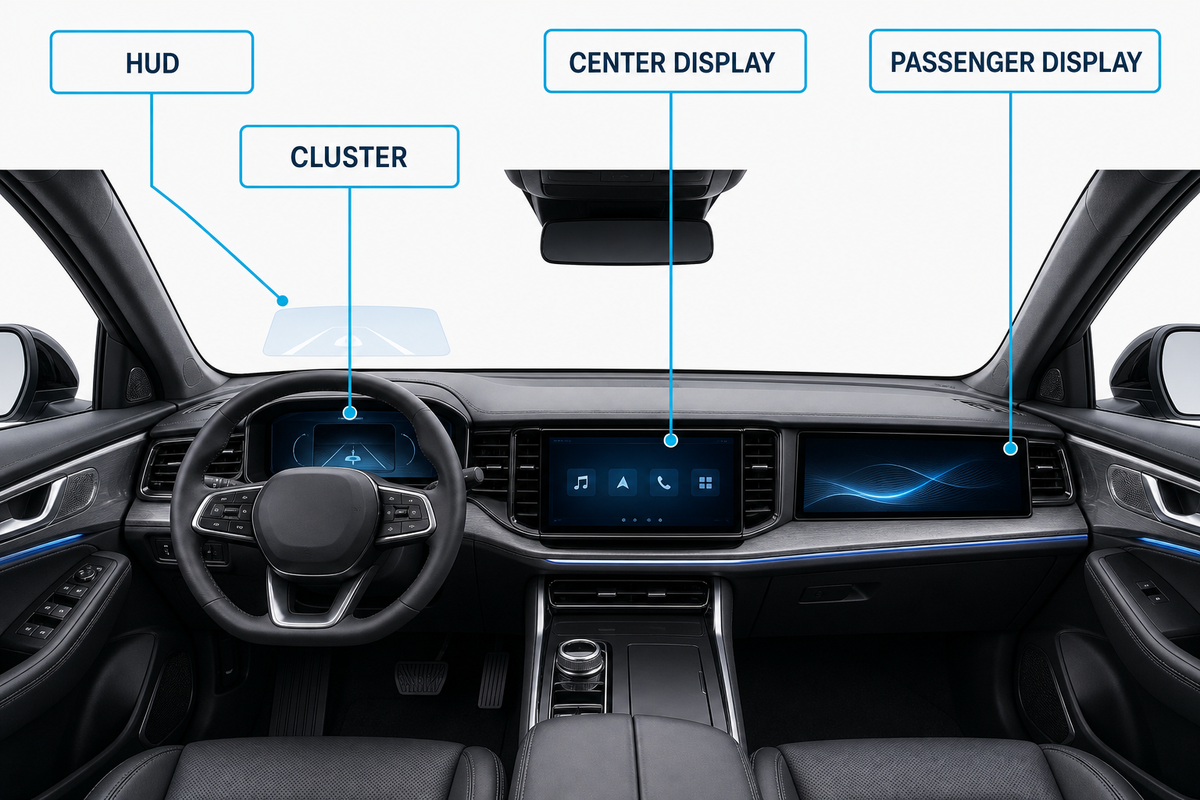
Dashboard screens, unlike aftermarket screen mirroring devices on dashboard mounts, need to be classified according to the type of task supported and the consequences of missing the information. Display structures may be shared among instrument clusters, center information displays, passenger information displays, and head-up displays (HUDs), for example. However, the behavior of driver’s glance, touch, viewing zone, geometric configuration, and failure modes may be significantly different among the different displays, while an HD touchscreen label provides insufficient engineering detail.
ISO 15008’s public record illustrates why scope is important: the visual-presentation standard defines covered information and explicit exclusions rather than treating every cockpit image as one requirement set.
| Screen type / cockpit zone | Primary task | Design focus | Evidence to request |
|---|---|---|---|
| Instrument cluster | Speed, warnings, vehicle state | Rapid recognition, day/night readability, controlled failure behavior | Installed optical results, viewing-zone results, fault-state plan |
| Center information display | Navigation, climate, media, settings | Touch, fingerprints, glare, reach, interaction depth | Touch maps, surface durability, cleaning compatibility |
| Passenger display | Media and secondary information | Privacy, off-axis behavior, driver distraction control | Viewing-cone map and vehicle-level assessment |
| HUD-related surface | Projected driver information | Flatness, wedge, birefringence, ghost-image control | Projection-path drawing and optical inspection report |
| Climate control display | Frequent comfort adjustment | Glance time, tactile backup, temperature and touch response | Task-completion and touch-condition matrix |
| Camera monitor display | Rear or side visibility support | Latency, dynamic range, glare and fault indication | End-to-end camera/display timing and image checks |
| Rear-seat display | Passenger media and controls | Wide viewing, impact exposure and cleaning | Viewing map, surface durability and mounting evidence |
| Mirror-replacement display | Continuous driving scene | Latency, focus transition, reflections and failure fallback | Vehicle-level visibility and fault-state assessment |
| Roof or overhead display | Shared cabin information or entertainment | Mounting retention, off-axis image and head-impact environment | Mounting, vibration, viewing and safety evidence |
Consider a decorative wide cockpit panel spanning the instrument cluster and center information display. From a procurement perspective, it may be seen as a single large glass part. However, the driver may see it as two information displays, the display engineer may see it as two viewing zones, and QA may see several bonded interfaces. Using “automobile-grade displays” obfuscates these disparate concerns. The role map prior to styling freeze requires each viewing zone to have evidence to support it.
Compare LCD, OLED, and Mini LED Against the Duty Cycle
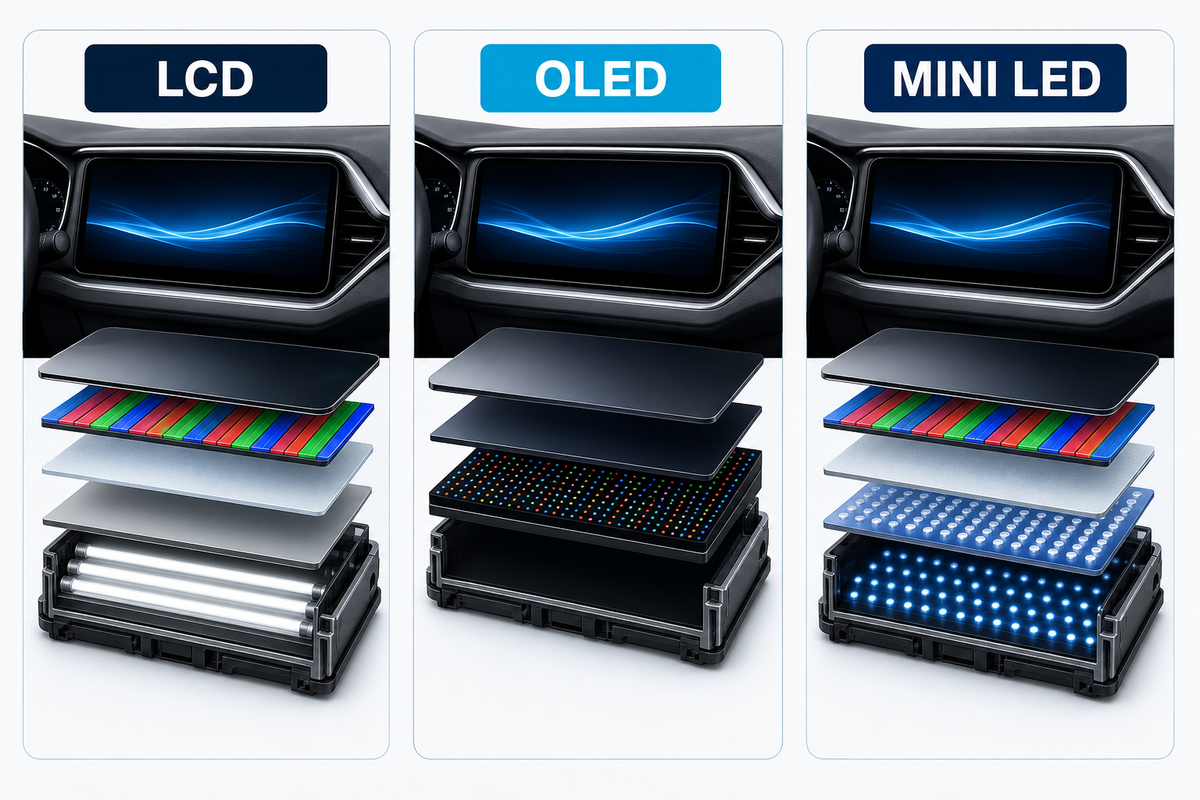
Comparing LCD, OLED, and Mini LED against the mission of the vehicle is a better way to judge these technologies rather than ranking them in a ‘better or worse’ light. Factors such as static content exposure, black level, local contrast, peak and sustained luminance, temperature, power, package depth, curvature, sourcing, lifetime, cost, and many others, need to be in the evaluation.
The independent research review found no authoritative basis for a universal winner; SID’s automotive-display technology outlook is useful context, while each production program still needs its own duty-cycle tests.
| Technology | Useful strengths | Questions before selection | Production evidence |
|---|---|---|---|
| Automotive LCD | Mature supply options and controllable backlight architecture | How do black level, backlight heat, uniformity, and viewing angle behave in the final stack? | Luminance maps, mura criteria, dimming curve, thermal results |
| OLED | Per-pixel emission, deep black, thin and potentially flexible formats | What static-image duty, compensation strategy, temperature, life, and brightness profile were validated? | Aging protocol, image-retention criteria, compensation logs |
| Mini LED-backlit LCD | Local dimming and higher local contrast while retaining an LCD cell | Are blooming, zone transitions, power, heat, algorithm behavior, and content edge cases acceptable? | Zone test patterns, thermal maps, firmware revision, worst-case scenes |
Static telltales and warning icons make dashboard duty different from a television demo loop. Therefore, evaluation of image retention should be done with the intended, production content. Mini LED needs to be tested for the performance of zone algorithms and patterns rather than relying on a datasheet. Temperature and the cover and touch stack need to be taken into account for LCD and backlight performance. The correct output should be a controlled trade-off.
Validate Readability as Ambient Contrast, Not Nits Alone
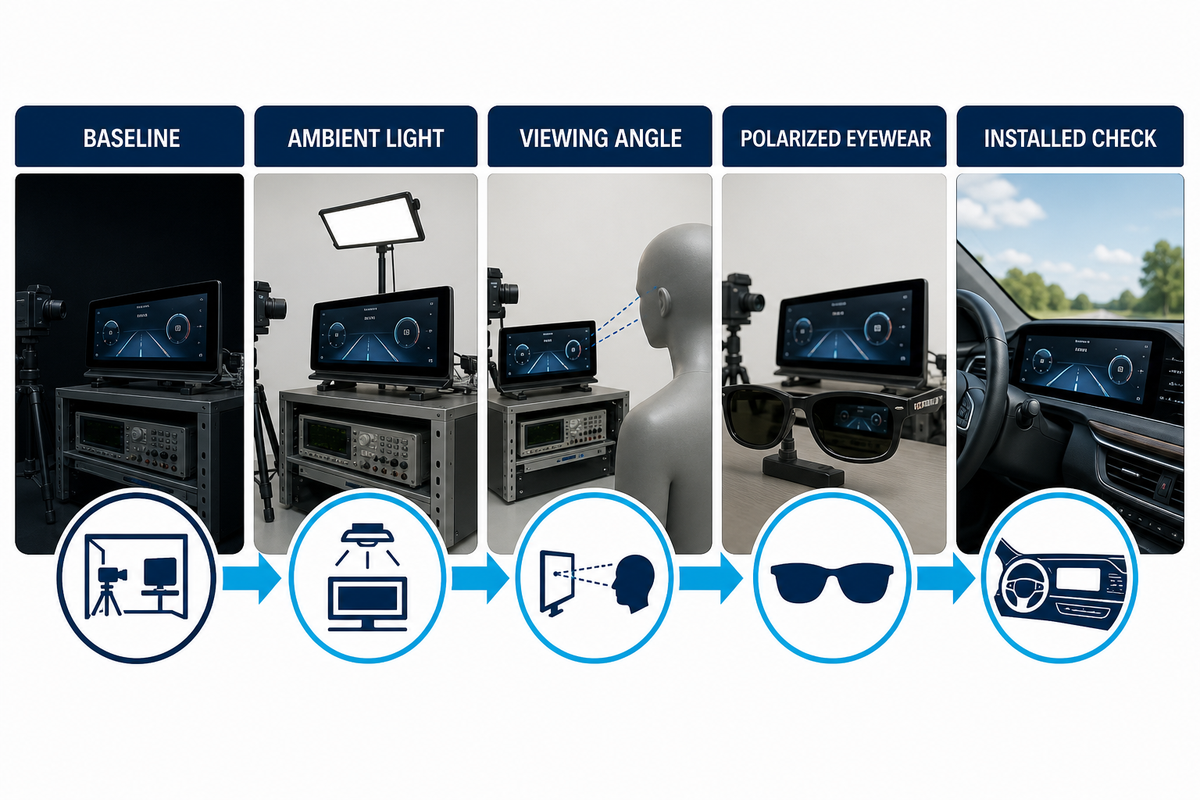
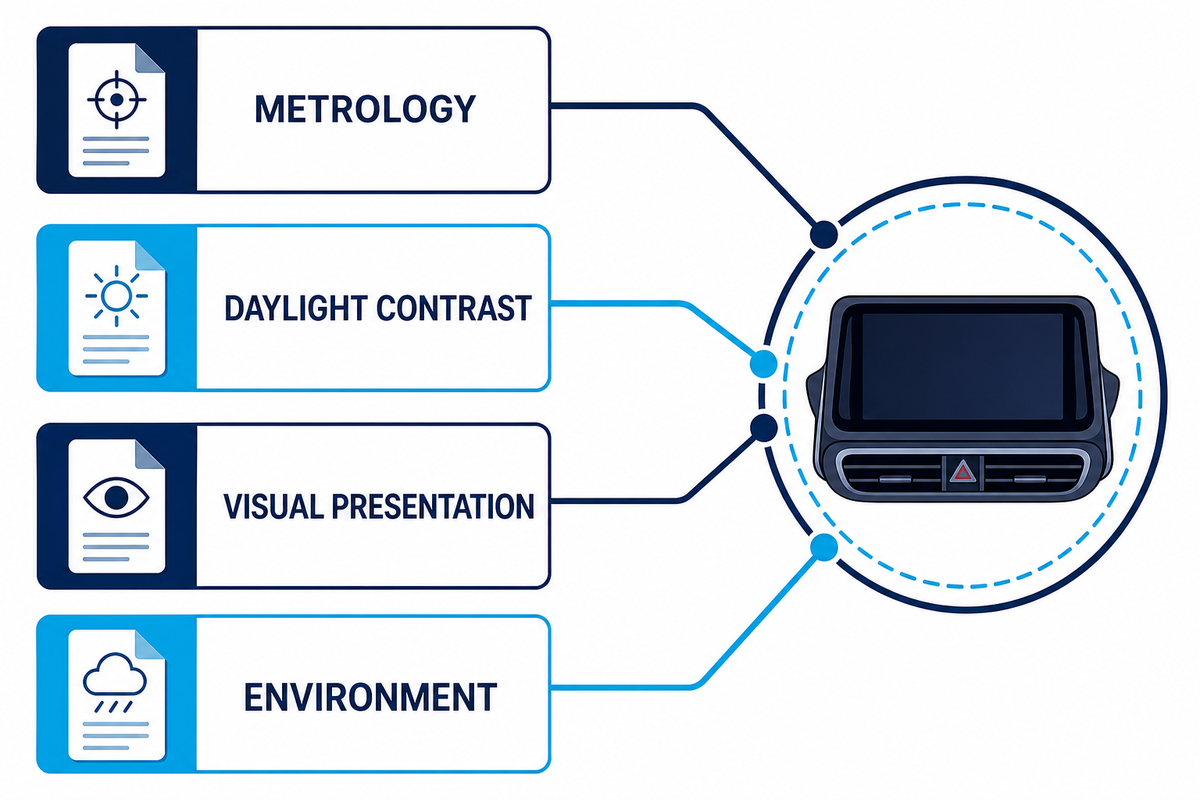
There are a lot of factors that contribute to readability, including emitted luminance, reflected ambient light, and viewing geometry. Peak nits may help design, but a high number doesn’t help explain what a driver is seeing when they look at a reflective surface that’s displaying control information.
“It is not the scope of this document to set threshold values for automotive compliance.”
SAE J1757/1 describes measurement methods for vehicular displays under automotive ambient illumination, including high-ambient contrast, while its public scope explicitly avoids universal compliance thresholds. NIST publications likewise treat ambient contrast and reflectance as measurement problems. The practical lesson is to declare the method and conditions before comparing results.
5-Step Ambient Contrast Validation Map
- Panel state: document white, black, color, warning-icon, map, and dimmed night content.
- Light field: define illuminance, distribution of source, cabinet reflections, incident light, and if the source is direct or diffuse.
- Observer zone: measure representative driver eye positions, not normal incidence, and state installed tilt.
- Complete stack: state touch screen, adhesive, cover glass, coatings, printing, and production surface conditions because an HD touch screen label provides insufficient detail for stack validation.
- Use conditions: repeat with fingerprints, cleaned state, temperature state, representative polarized eyewear, and other conditions that can impact results.
Imagine two cluster samples with the same supplier-stated peak luminance. Sample A has an air gap and a glossy cover. Sample B has a controlled bonded stack. In a dark room they may look similar, but under an angled bright source, added interfaces and surface reflections can change black-state luminance and perceived contrast. The buyer should compare both samples with one method, one fixture, one content set, and one observer zone rather than picking the winner from the nits column.
Engineer the Cover Glass as a Stack
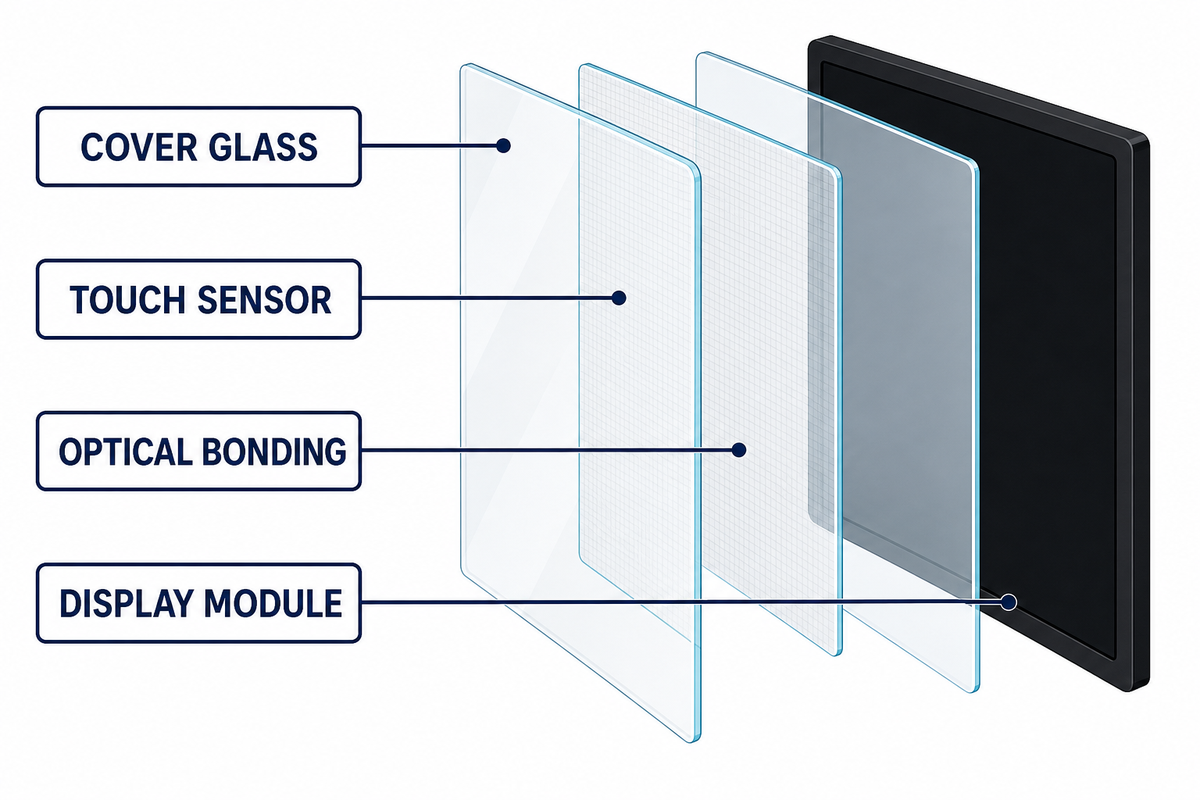
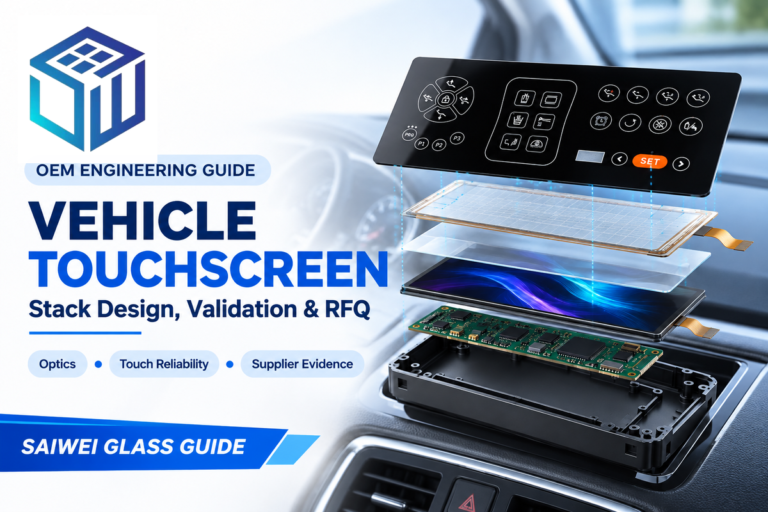
Cover glass is part of an optical and mechanical system as well as a touch sensing system. Substrate, chemical strengthening, edge condition, printing, anti-glare texture, anti-reflective coating, anti-fingerprint treatment, touch sensing system, adhesive, display polarizers, housing support, and assembly cleanliness can trade-off one requirement against another.
Stack Interaction Map
- AG texture can diffuse sharp reflections, but haze and sparkle can affect perceived detail.
- AR coating can reduce surface reflections, but mismatch of design band or angle can adversely affect reflection.
- AF treatment affects the touch residue and the surface’s ability to be cleaned; it isn’t a substitute for an optical specification.
- Optical bonding can eliminate an air interface, however, control of stress, aging, bubbles, adhesive cure, process, and rework remain part of qualification.
- Printing and border affect color, registration, sensor windows, and adhesive shape, as well as cosmetic inspection.
Saiwei’s public automotive page gives supplier-stated AR-treatment examples of transmission above 95% and reflectance below 1%. These aren’t universal acceptance values: an RFQ should request the wavelength band, incidence angle, instrument, substrate, coating side, durability condition, lot tolerance, and report format.
When thinking about coatings, the important question to consider isn’t “AG or AR?” It’s what reflection mechanism and user condition need to be managed. When talking about bonds, the important question is what measurable improvement is required and what process risk is introduced by the assembly process. A supplier capability statement is a good starting point; a revision-controlled stack drawing with production-intent validation is a good place to end.
Design Touch, Controls, and HMI Together
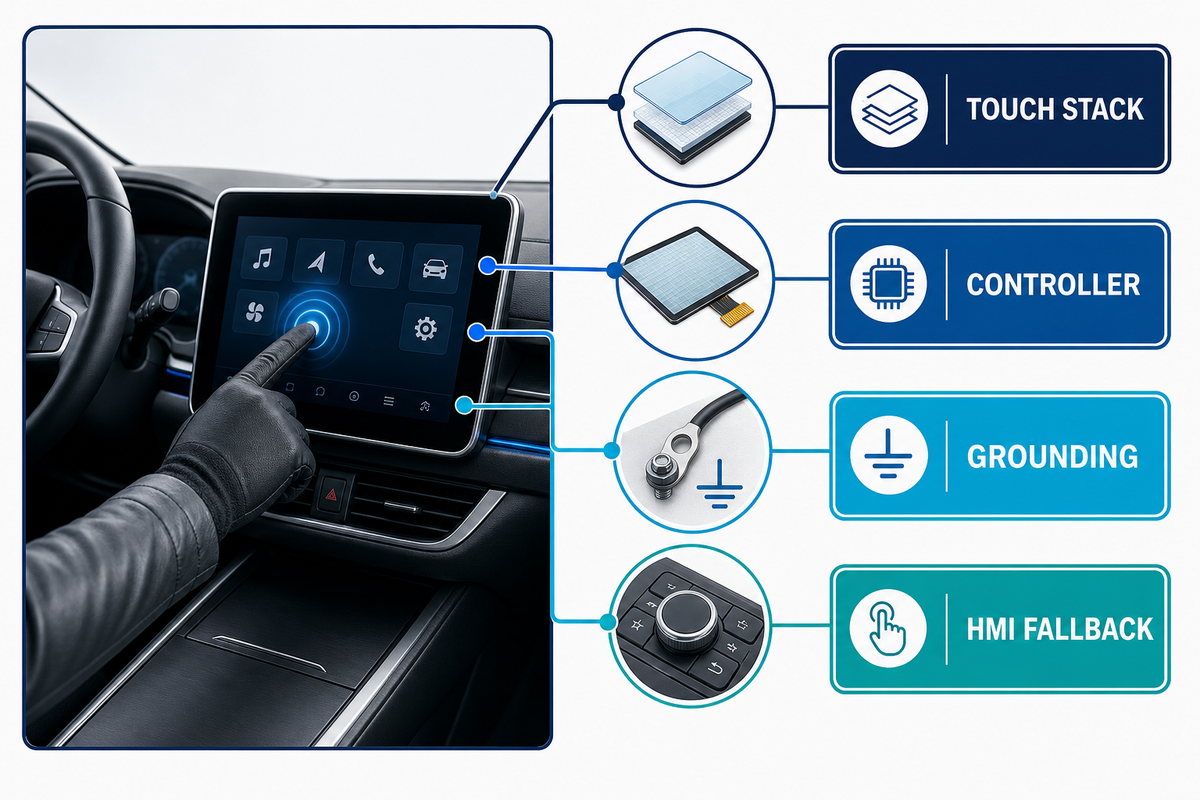
Touch performance is an aspect of human-machine interface, not of a sensor. There are many factors that affect touch performance, including the thickness of cover layer, pattern of sensor layer, tuning of controller, type of gloves, amount of moisture on skin, grounding, noise on display, bezel geometry, size of target, haptic or physical feedback, response time, and state of software.
Saiwei’s automotive display capability page shows several touch-stack structures and integration options. The final controller tuning and vehicle-level HMI acceptance remain program specific.
A functional touch matrix must consider bare and gloved fingers, edge targets, multi-touch gestures, dry and wet conditions, temperature extremes, electrical-noise states, start-up, sleep/wake, defined false-touch limits, and state changes. Each condition must be linked to production-intent hardware and controller firmware. If the design team understands that a function can’t tolerate a missed touch, it’s the responsibility of the vehicle-level control concept to resolve this; using a piece of thicker glass or a different sensor stack alone won’t resolve this HMI problem.
Convert Vehicle Conditions Into a Validation Plan
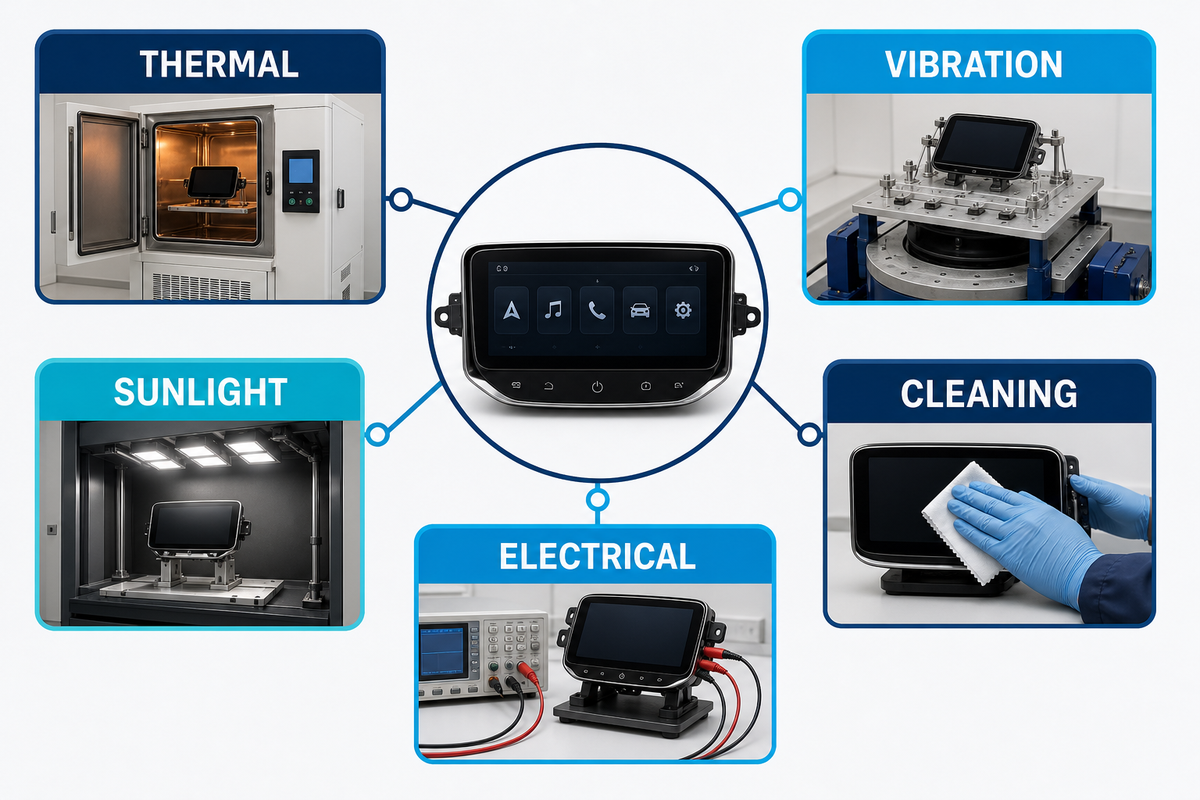
An automotive dashboard screen validation plan should encompass controlled exposure, functional checks, and measurable pre/post endpoints of the installation and mission profile. “Automotive grade” doesn’t constitute a complete test plan, and public standards won’t take the place of the OEM’s applicable specs, regional considerations, and/or program-specific risk assessment.
Standards context for environmental conditions for the testing of vehicle electrical and electronic equipment is provided in the ISO 16750-1 catalog record. The relevant parts and severities must be identified for the mounting location and program.
| Stress | Define before test | Pre/post endpoints | Typical hidden gap |
|---|---|---|---|
| Temperature and humidity | Profile, dwell, ramp, powered state, condensation control | Optics, touch, bond, cosmetic, electrical function | Testing parts separately instead of the assembled stack |
| Vibration and shock | Vehicle location, spectrum, axes, fixture, duration, powered state | Connector, image, touch, rattle, glass and bond inspection | A fixture that does not reproduce installed support |
| UV and surface durability | Spectrum, dose, temperature, cleaners, abrasion medium | Color, haze, reflectance, adhesion, appearance, cleanability | Evaluating appearance without measuring optical change |
| Electrical and ESD | Interface state, grounding, discharge method, recovery rule | Display, touch, communication, stored faults, recovery | Calling a reset “pass” without an agreed recovery criterion |
ISO 16750 is relevant for environmental conditions and testing of vehicle electrical and electronic equipment. However, the applicable part, edition, mounting location, severity, and customer specification must be verified. Public editions of ISO catalogs show that editions do change. Write the edition in your plan rather than just “tested to ISO.”
Diagnose a Black, Dim, Delaminated, or Ghost-Touch Screen by Layer
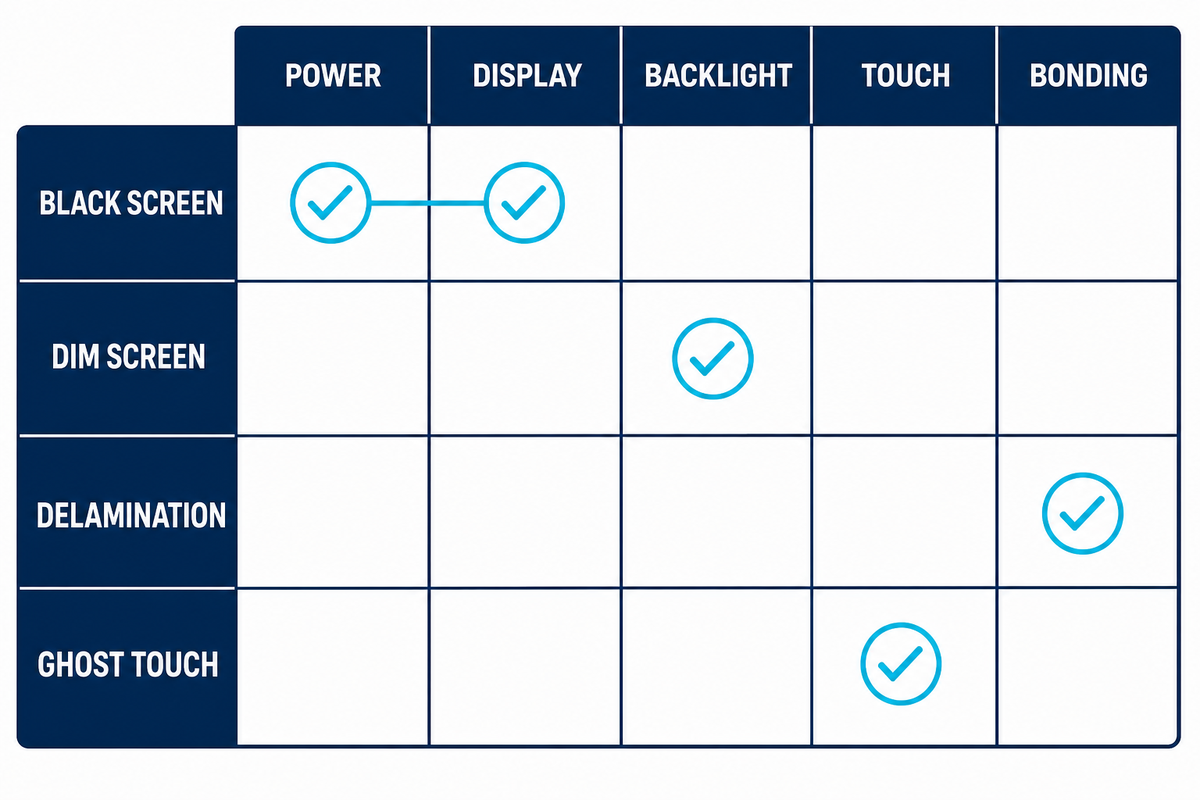
Dashboard screen diagnosis should isolate power, communication, processing, display, backlight, touch, bonding, cover, and software layers before assigning a root cause. Similar symptoms can originate in different layers, so replacing the visible panel first can conceal an intermittent vehicle, connector, controller, or thermal problem.
The failure mechanisms on Saiwei’s automotive display page are examples, not a complete diagnostic tree. Controlled isolation is still needed to pinpoint the problem to the correct layer.
- Black Screen OR no backlight OR frozen content OR intermittent reset OR dim region OR touch offset OR false touch OR haze OR bubble OR coating damage.
- Record the state: temperature, ignition state (off/on), supply, network state, software revision, elapsed time, and recent cleaning or service.
- Split image from illumination: determine if there’s content without visible backlight and if the fault occurs on the display or upstream signal.
- Split touch from display: log raw touch data and controller actions separately from checking image and vehicle communications.
- Inspect the optical stack: map bubbles, delamination, haze, Newton rings, contamination, print lift, coating damage, and edge stress to drawings and process history.
- Use controlled substitution: replace one known-good layer or signal path at a time. Leave the failed part for analysis.
A screen that goes black only after a hot soak may involve the backlight, connector, power rail, display timing, controller protection, or software, rather than the cover glass. A touch offset after exposure to humidity is different from a bond-line bubble. The failure report should preserve conditions, logs, photos, serials, revisions, and the substitution sequence to help isolate the root cause.
Write a Car Dashboard Screen RFQ That Can Be Measured
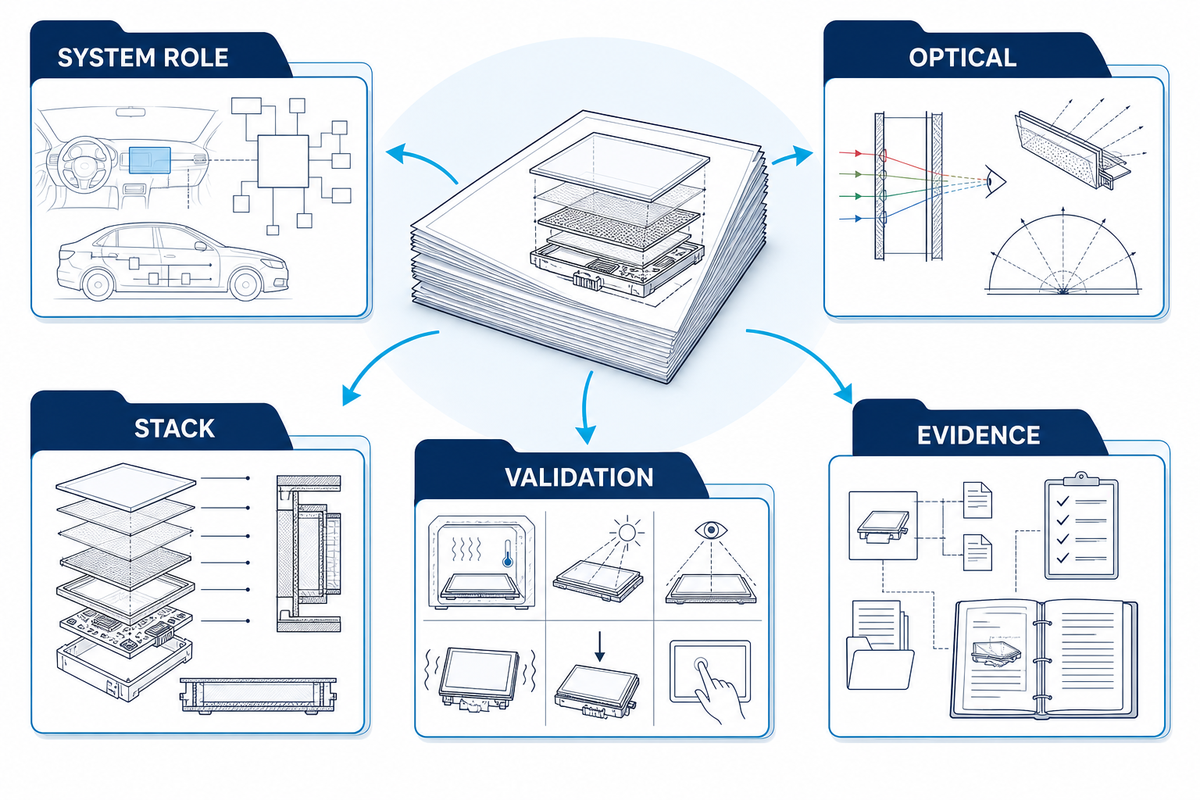
A strong dashboard-screen RFQ connects every critical requirement to a method, condition, limit, sample, revision, traceability rule, change-control trigger, and evidence deliverable. Using this structure allows the engineering team to communicate the same thing as the QA team and procurement and the supplier. It prevents attractive samples from becoming undefined production promises.
Use the inputs on Saiwei’s auto display project page to create your measurable evidence set.
Dashboard Screen RFQ Field Set
- System role: cluster, center display, passenger display, control panel, HUD-related surfaces; safety and fallback assumptions.
- Optical target: include content states, luminance and dimming, reflectance, ambient contrast, color, viewing zone, uniformity, mura, polarization, and test geometry.
- Mechanical Stack: Think in terms of active areas, outlines, thicknesses, curvatures, supports, tolerances, edges, glass, strengthening, print, coating, touch, adhesives, seals, and connectors.
- The control system should be designed to accommodate thermal, humidity and vibration profiles found in the operational and storage environments. It should account for UV exposure and cleaners, abrasions and ESD/EMC interactions. The system should be designed to accommodate various powered states.
- Software and Interfaces: Interfaces, controllers, firmware, diagnostics, startup, recovery and update responsibilities, and cybersecurity, if applicable.
- Drawings, control plans, capability data, inspection methodology, sample reports, traceability, deviation processes, PPAP/APQP forms/processes, and warranty return analyses.
- Supply: prototype and validation quantities, forecast, capacity evidence, tooling, lead time, lifecycle, obsolescence, packaging, logistics, and change notification.
The RFQ should require accepted program evidence. Tie certificates to an accepted program condition, and relate which measurements are performed on bare glass versus the final assembly. Specify who owns each gap. A statement such as “AR coating available” can’t be compared across quotations until the optical target and test condition are defined.
Qualify the Supplier With Evidence, Not Capability Lists
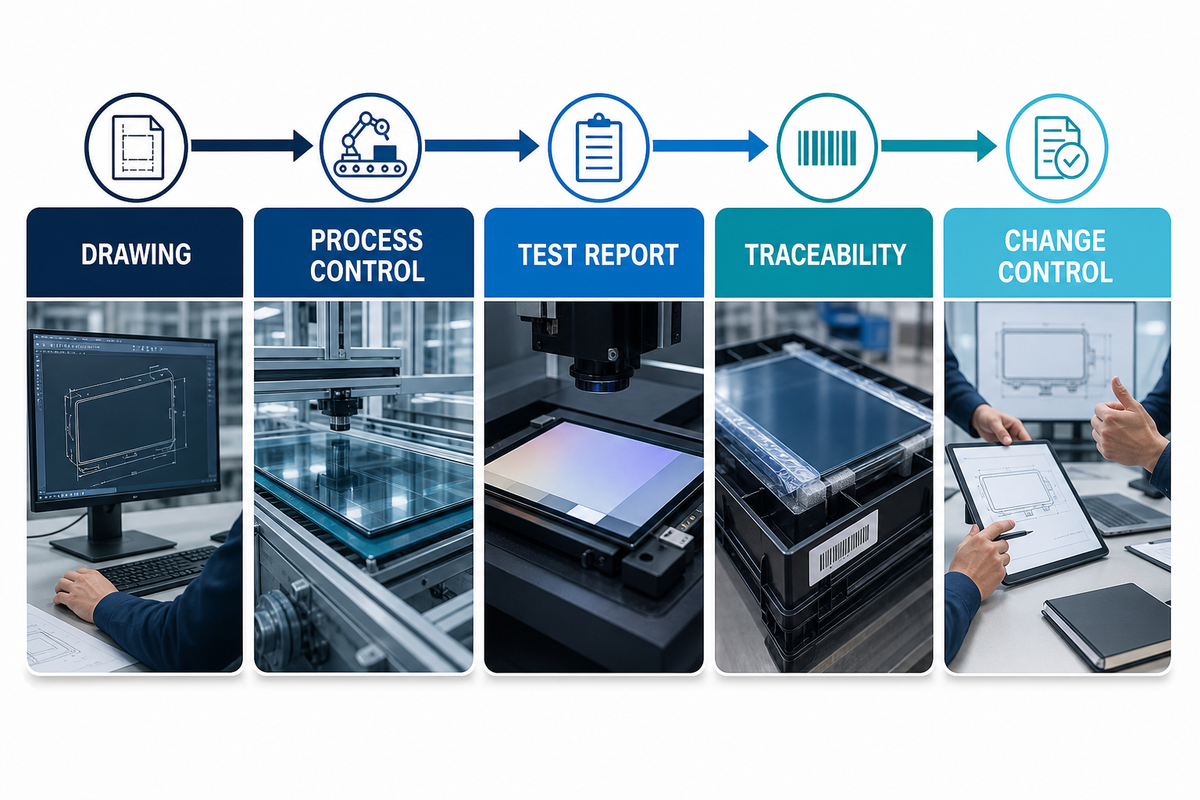
Using acceptable evidence for qualification, trace the control of the glass through coating, printing, touch, and bonding, and verify records for module integration, test, inspection, software, and fixtures. Control of subcontracted operations should also be evaluated.
Saiwei’s About Us page provides background and a general manufacturing description. Qualification should assess the specific site, line, process, certificate and capacity for the part in question.
- Design evidence includes signed drawings, stack definitions, material and coating specifications, DFM decisions, and requirements ownership.
- Process evidence: a flow diagram, process critical parameters, calibration, measurement system analysis, and capability.
- Validation evidence: test, inspection, and production-intent samples; and raw data, test configuration, failures, corrective actions and deviations.
- Production evidence: control plan and outgoing inspection, capacity and an escalation path.
- Change evidence: change window, logic for requalification, material and firmware revision control, and last time buy planning.
Saiwei Glass says it provides automotive cover glass, touch panels, optical bonding, TFT modules and custom processing. With this, start supplier discussions and tie the selected program to drawings, process flow, limits, reports, and controlled samples. This keeps the guide educational and the linked automotive page the owner of commercial capability and quotation intent.
Frequently Asked Questions
What is the screen in the middle of a car dashboard called?
Another name for the middle screen is the center info display, center stack display, or infotainment screen, to name a few. When writing a specification, name the vehicle location and specify the function, viewing angle, touch involvement (if any), interfaces, and failure behavior, rather than depend on a marketing name.
Is OLED better than LCD for a car dashboard screen?
OLED is not universally better than LCD. Automotive LCD solutions may offer mature supply choices and different lifetime, thermal, and cost profiles. For OLED, compare static-content duty, temperature, luminance, contrast, aging, and power. For LCD, compare the complete touch-and-cover stack, package, validation, and lifecycle requirements.
How bright should an automotive dashboard screen be?
Not every vehicle can use the same luminance. The needed luminance is based on the role of the screen, content, reflections, dimming limits, ambient light and viewing angle. Specify what contrast the touch and cover stack meets under defined conditions, and use luminance as one controlled input rather than the only acceptance criteria.
Why does a car dashboard screen go black?
Black screens can originate in power, grounding, communication, processor, software, connector, display, backlight, or thermal faults. Record the state and conditions of the vehicle, separate image generation from illumination, evaluate diagnostic logs, and swap out one element at a time. Visible glass shouldn’t be suspected in the absence of evidence of inspection and isolation.
What should an automotive display RFQ include?
A request for quotation (RFQ) for automotive displays should include the system role, content and viewing zones, optical methods and targets, complete mechanical and touch stack, interfaces, environment, qualification profile, pre/post endpoints, cosmetic criteria, sample plan, drawings, traceability, change control, quality deliverables, forecast, capacity, lifecycle, packaging, and acceptance evidence. Every critical field must have an owner and revision.
References & Sources
- SAE J1757/1 public scope: Standard Metrology for Vehicular Displays
- NIST: Display Daylight Ambient Contrast Measurement Methods and Daylight Readability
- ISO 15008:2009 catalog record and superseding-edition notice
- SID: Automotive display technology outlook
- ISO 16750-1:2018 catalog record
- Saiwei Glass: Automotive Display Glass Solutions
Define the Stack Before You Request a Quote
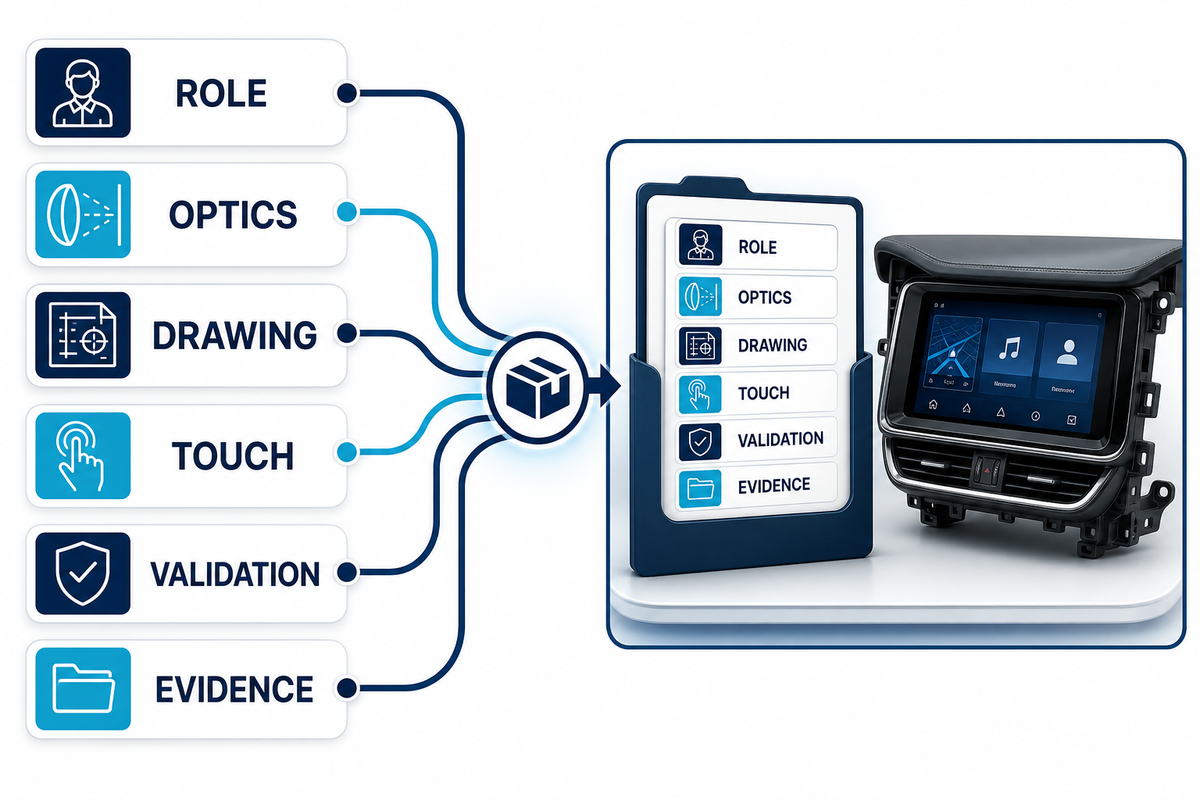
Bring the screen role, optical conditions, drawing, touch requirements, validation profile, and evidence checklist to Saiwei Glass automotive display specialists.