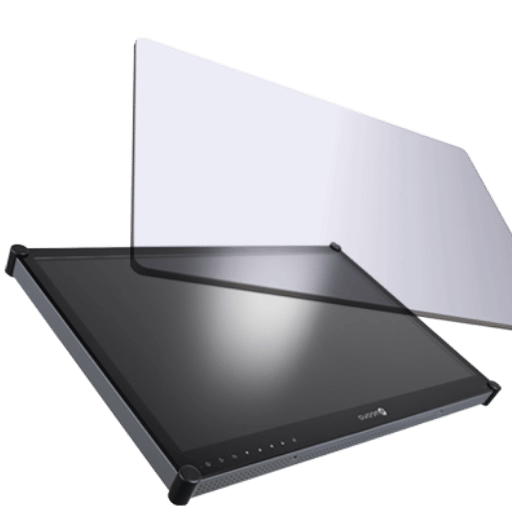
Get in Touch with Saiweiglass



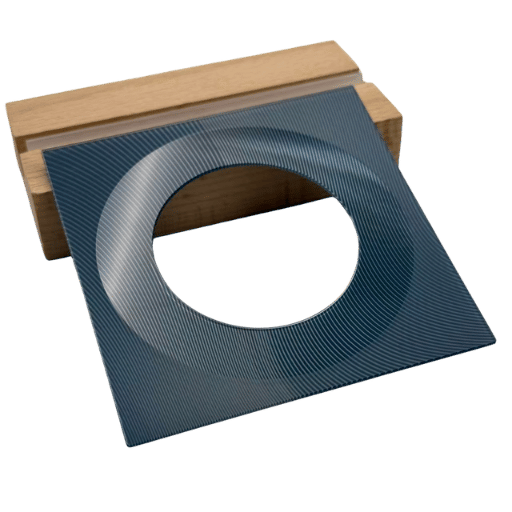
Quick Specs
| Transmittance (visible) | 88–93% @ 380–700 nm |
| Haze | 1–30% |
| Gloss (60°) | 10–135 GU |
| Surface Roughness (Ra) | 0.05–1.5 µm |
| Distinctness of Image (DOI) | 10–95 (scale 0–100) |
| Available Thickness | 0.5–6.0 mm (tolerance ±0.10–0.15 mm) |
All AG glass plates begin as a sheet of transparent float glass. After chemical etching or spray coating, it is given an anti-glare surface; however its transmittance, haze, and gloss are set depending on processing selection. Cutting the right combos back to the drawing board is where you end up with an obscuring display or one that is too reflective for daytime viewing.
This reference analyzes 7 quantifiable AG glass parameters, details how they are tested, and correlates specific value numbers to applications such as surgical monitors to building entry outdoor kiosk panels.
What Is AG Glass and Why Do Optical Parameters Matter?
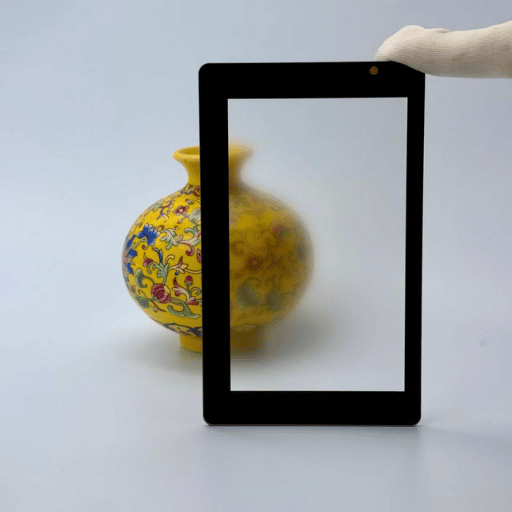
AG glass—short for anti-glare glass is regular float glass whose surface has been coated to cause reflection to be scattered in many directions. As opposed to the reflective surface acting as a mirror, the new coating acts similar to the diffuse reflection sending reflected light in many directions. Hence, displays are visible in the presence of incident light at large angles to the display:
From microscopic texture generated on ag glass surface during processing, it is known as the anti-glare effect. Chemical etching tears with Acid solution the upper layer of the ag glass surface to establish even peaks and drops over huge scales, while spray coating bonds sub-micron silicon dioxide particles onto the glass surface.
They are the same modifying factor surface roughness; however, surface roughness also originates in the parameters:
Why don’t the properties of ag glass matter?
Because optical transmittance alone isn’t a number. An 88% transmittance, 28% haze panel will look stunning on a high-res medical monitor, a 3% haze, 123 GU gloss panel will reflect overhead light on an outdoor kiosk. Selecting the right balance of ag glass parameters for the environment is not a guess, it is an engineer’s decision.
There are seven quantifiable parameters of ag glass that characterize its optical and physical performance in the display: transmittance, haze, gloss, surface roughness, granulation of particles, thickness, and definition of image. Together, these parameters determine the optical transparency of the finished panel. They are all specified using established measuring devices and processing methods and every one of them directly influences the readability of the display, the response to touch, and the load-bearing ability of the finished panels.
Transmittance — How Much Light Passes Through AG Glass?
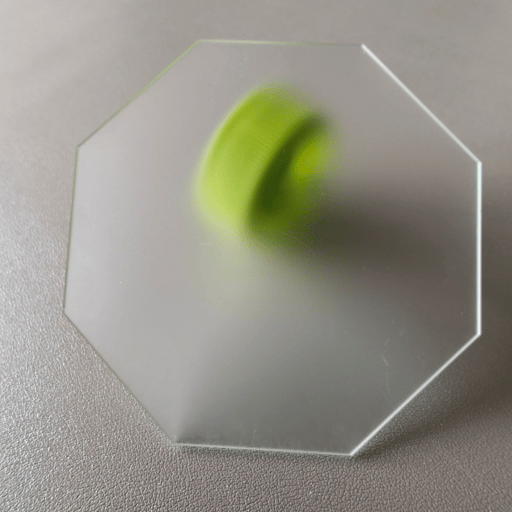
Transmittance indicates the proportion of incident light that passes through the glass and reaches the display panel. For transparent or translucent materials like AG glass, this light transmission metric is the most commonly cited optical parameter given its ultimate influence on screen luminance; the higher the transmittance value, the brighter the displayed image presents to viewers.
In commercial production the transmittance of ag glass usually has a transmittance of about 88-93% over the visible spectrum (380-700 nm). Raw float glass begins at approximately 91-92%. Chemical etching appears to decrease the transmittance by 1-3% depending upon the depth of the etch.
Transmittance decreases by approximately 2-5 points for spray coating due to scattering by surface particles.
| Etch Level | Transmittance Range | Typical Application |
|---|---|---|
| Light etch (110–130 GU) | 91–93% | Medical monitors, office displays |
| Medium etch (70–110 GU) | 89–91% | Industrial HMI, retail POS |
| Heavy etch (40–70 GU) | 88–90% | Outdoor kiosks, marine displays |
Transmittance testing procedures align with ASTM D1003, which specifies two testing protocols. Procedure A uses a hazemeter with a CIE’s illuminant C or D65 white light source. Procedure B uses a spectrophotometer that can scan across the wavelength regions from 400-700 nanometers. Both procedures output the total luminous transmittance as a single percentage, but Procedure B can also provide a graph of spectral transmittance—helpful to applications that require color accuracy, such as medical equipment displays for diagnostic imaging. The higher transmittance and adequate light transmission ensure that clinicians can trust the on-screen color accuracy.
The transmittance of ag glass is closely related to glass thickness. Thicker substrates absorb more light passing through the glass. A 1.1 mm panel may test at 92% while a 4.0 mm panel of the same etch grade measures 89%. When comparing AG glass transmittance specifications across suppliers, always confirm substrate thickness and test wavelength range.
📐 Engineering Note
Transmittance testing for AG glass, Procedure B: spectrophotometer scan from 400 to 700 nanometers, CIE D65 illumination, 0/diffuse geometry. Acceptable measurement tolerance: ±1.5% between instruments. When specifying AG glass for medical applications, demand that the entire spectrum’s transmittance graph be presented, not only the irradiance ratio. Under 88% at any wavelength between 450–650 nm indicates faulty panels unsuitable for diagnostic displays.
Haze — Measuring Diffuse Light Scatter in AG Glass
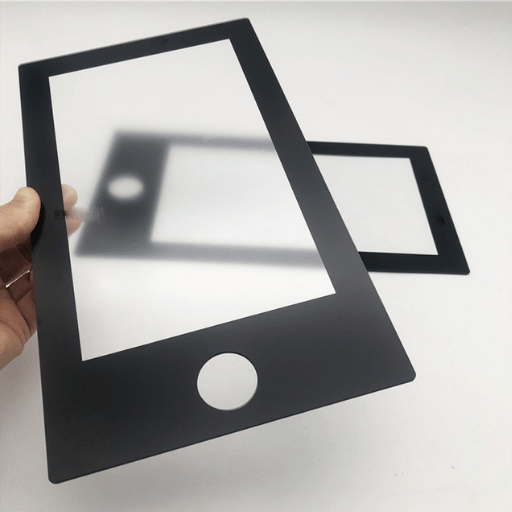
Haze is defined as the percentage of transmitted light intensity that deviates from the incident beam by more than 2.5°. In practical measurement terms, haze measures exactly how much ag glass surface diffusely redirects transmitted light instead of allowing all light to travel on a perfect straight path. The greater the haze, the higher the anti-glare effect. Yet, excessive haze can blur the images behind the glass while reducing the total transmitted light intensity reaching the viewer.
Specifically, measures of haze for anti-glare AG glass can range from 1% to 30%. If the limits seem absurd, this is why it is necessary to keep the property balanced: too weak, and the panel can exhibit properties nearer to 0%; too strong, and the texture becomes a cloudy or turbid appearance that makes personal displays (above 150 PPI pixel) unreadable.
| Haze Grade | Haze Range | Glare Reduction | Display Suitability |
|---|---|---|---|
| Ultra-low | 1–5% | Minimal | Retina displays (>200 PPI), medical imaging |
| Low | 5–12% | Moderate | Tablets, automotive infotainment, cash registers |
| Medium | 12–20% | Strong | Industrial HMI, ATM screens, POS terminals |
| High | 20–30% | Maximum | Outdoor kiosks, EV charging stations, digital signage |
Technically, haze is the percentage of total transmitted light intensity that deviates from the incident light direction. Measurement follows ASTM D1003 using an integrating sphere. It captures both total transmittance and diffuse transmittance, then calculates haze as the ratio of the light that scatters diffusely to total transmitted light.
Haze and gloss in AG glass are inversely proportional: higher the haze, lower the gloss. Gloss is inversely proportional to the haze — and also inversely proportional to the roughness — because all three properties derive from the same surface structure. Rougher surfaces cause more scattering of bright reflected light (lower gloss) while simultaneously scattering more transmitted light (higher haze).Their inverse nature precludes extreme values of both parameters being specified simultaneously.
⚠️ Common Mistake
If you specify just the haze without taking into account the display pixel density value, then a haze of 25% will sufficiently work for most industrial computer screens with 100 PPI resolution, but will ruin sharpness of text on regular 300 PPI tablets. For this reason, you should always match the haze grade to the display resolution: under 200 PPI, keep it below 8%.
Gloss and Surface Roughness — The Inverse Relationship
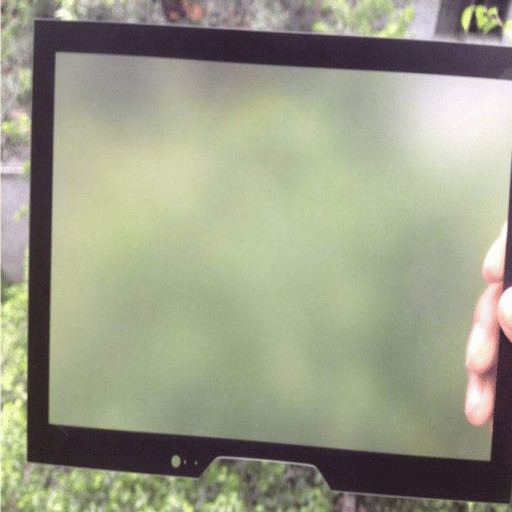
Gloss rate of the specular reflection is the percentage of incident light reflected off the ag glass surface at a specified angle. The gloss rate of AG glass is measured at 60° incidence per ISO 2813, and reported in gloss units (GU). higher the gloss dictates the evenness of the surface. lower the gloss indicates how the surface scatters reflected light away from it, driving down glare for the viewer.
Surface roughness refers to the arithmetic mean deviation of the surface profile, or Ra, which is used to describe the roughness of any surface is reported in µm (micrometers) per ISO 4287. Roughness describes the microscopic peaks and Valleys formed during etching (or any coating). For anti-glare glass, surface roughness is normally between 0.05 µm (a light etch, almost smooth surface) and 1.5 µm (a heavily etch surface for industrial panels).
Gloss is inversely proportional to the roughness of the ag glass surface — surface roughness is generally the primary driver. As roughness climbs higher, the microscopic texture scatters more reflected light, driving gloss values down. This relationship follows a predictable curve:
| Gloss Grade (60°) | Ra Range | Haze Range | Surface Character |
|---|---|---|---|
| 110–135 GU | 0.05–0.15 µm | 1–3% | Near-smooth, slight matte finish |
| 70–110 GU | 0.15–0.40 µm | 5–12% | Visible matte, balanced clarity |
| 40–70 GU | 0.40–0.80 µm | 12–22% | Strong diffusion, reduced clarity |
| 10–40 GU | 0.80–1.50 µm | 22–30% | Maximum anti-glare, paper-like texture |
Gloss of an AG glass sample also correlates inversely proportional to the haze — making these three parameters (gloss, roughness, haze) a tightly linked triad. Changing one shifts the other two along predictable ranges. This triad behavior explains why experienced engineers specify AG glass by gloss grade as the primary control parameter: once gloss is locked, roughness and haze fall into predictable ranges.
💡 Pro Tip
When evaluating ag glass samples from multiple suppliers, always measure gloss at 60° and confirm Ra on both sides of the panel to check for asymmetries in the manufactured surface. Some manufacturing processes produce asymmetric roughness — the etched side may read differently from the untreated side. Specify which surface faces outward in your assembly drawing to prevent installation errors.
Distinctness of Image (DOI) and Clarity
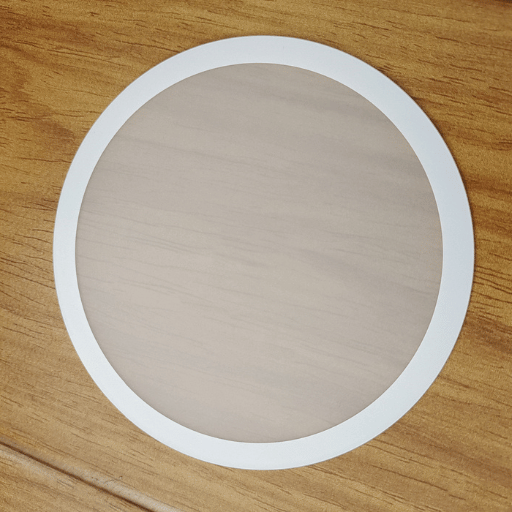
Distinctness of image measures how sharply the ag glass surface repeats a reflected image. Measured per ASTM D5767, DOI generates a score from 0 to 100 where 100 represents a perfect image. For anti-glare glass, DOI ranges from 10 (heavily etch, maximum scattering) to 90 (nearly any mirror image).
DOI is a different measurement than transmittance — an important parameter distinction that many buyers do not realize. Transmittance measures the amount of light transmitted through the glass. DOI measures how effectively the surface preserves that image in the reflected world. A panel may have 91% transmittance (a significant amount of light) but a DOI of 25 (a poor digital copy) that is perfect for an outdoor kiosk, but may not provide enough image detail for surgical monitors where the backscattered image detail matters.
AG glass clarity has traditionally been chosen by the particle span created by the surface particles formed in etching. The ag glass surface particles act as pixels in our digital images- the smaller the particles (and more evenly distributed), the higher the clarity and the overall performance of ag glass in display applications. Larger particles and a wider diameter of the surface particles make a more coarse texture which scatters more incident light therefore lowering the DOI. This is the reason the particle span indicator- or particle size distribution of surface particles- predicts the outcome of AG glass clarity ratings.
For displays with pixel density values above 200 PPI, specify DOI ≥ 70 to prevent visible sparkle artifacts. For standard industrial HMI panels at 100–150 PPI, DOI ≥ 40 is acceptable. Outdoor digital signage below 100 PPI tolerates DOI as low as 15 since viewers stand further from the screen.
How Etching Process Controls AG Glass Parameters

AG glass undergoes one of two surface treatment processes, and the choice determines which parameter ranges are achievable. Chemical etching uses acid to dissolve the glass surface, creating permanent microscopic texture. Spray coating deposits silicon dioxide particles onto the surface, then cures them with heat. Each process has distinct strengths and limitations that constrain your specification options.
| Parameter | Chemical Etching | Spray Coating |
|---|---|---|
| Surface Hardness | ≥7H (Mohs, same as base glass) | ~4H (coating layer) |
| Transmittance | 89–93% | 86–91% |
| Optical Uniformity | Consistent (acid reaction uniform) | Variable (spray pattern dependent) |
| Weather Resistance | Permanent (structure is in the glass) | Degrades over time (coating peels) |
| Post-Processing | Can cut, drill, temper after etch | Must apply coating last |
| Cost (per m²) | Higher (acid management, environment controls) | Lower (suitable for outdoor signage budgets) |
In chemical etching, etch depth is the primary control variable. Deeper acid penetration produces rougher surfaces, lower gloss, and higher haze. The AG glass undergoes changes where particle shape and number are influenced by acid concentration, reaction time, and bath temperature. Industrial etching lines maintain temperature within ±2°C and acid concentration within ±0.5% to keep batch-to-batch transmittance and texture consistent. Post-etch polishing recovers 1–2 percentage points of transmittance that the acid treatment initially reduces.
Spray coating AG glass has the advantage of lower manufacturing costs, which are attractive for large impact outdoor signage or electronic whiteboards, where price drives the decision with regard to durability. This glass offers a cost-effective option used in indoor signage and electronic whiteboards. At 4H coating hardness (the current industry standard), spray-coated AG glass is unsuitable for touch-intensive applications like smartphones, medical equipment, or agricultural machinery panels where repeated finger contact causes wear.
📐 Engineering Note
AG glass intended for indoor medical or industrial applications should have the following process specs specified in your purchasing order: etch depth ±0.01 mm, gloss variation ≤ ±5 GU within a single batch, transmittance variation ≤ ±1.0% panel-to-panel. Also request a Certificate of Conformance (CoC) citing ASTM D1003 with batch-specific ISO 2813 test result data. In multi-monitor workstations or surgical display arrays, these tolerances ensure the series of panels will not be noticeably different when installed side by side.
Selecting AG Glass Specifications by Application
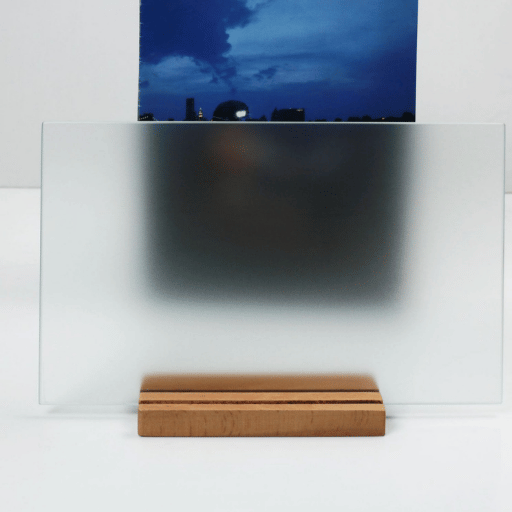
To match ag glass parameters to end-use application, prioritize competing factors such as increased transmittance, low haze, or maximum transmittance with minimum noise scatter. Below, the table shows your results for each of those end application choices, based on tested combinations of various parameter range recommendations (which in turn depends on application).
| Application | Gloss (GU) | Haze | Transmittance | DOI | Process |
|---|---|---|---|---|---|
| Medical monitors | 110–130 | 1–4% | ≥92% | ≥80 | Etched |
| Automotive infotainment | 80–110 | 5–10% | ≥90% | ≥60 | Etched |
| Industrial HMI / POS | 70–100 | 8–15% | ≥89% | ≥40 | Etched |
| ATM / Cash registers | 60–90 | 10–18% | ≥89% | ≥35 | Etched |
| Outdoor kiosks / EV chargers | 40–65 | 18–28% | ≥88% | ≥15 | Etched |
| Digital signage (indoor) | 50–80 | 10–20% | ≥88% | ≥20 | Etched or spray |
A pattern emerges from the matrix: as operating environments get brighter, the specified gloss drops and haze rises. This tradeoff is driven by physics — stronger anti-glare requires rougher surfaces, which scatter more of the light that passes through the panel. There is no AG glass specification that delivers both maximum transmittance and maximum anti-glare simultaneously. So the engineering question is always where to draw the line.
Decision Framework: Match Haze to Display PPI
- <100 PPI (outdoor signage, large kiosks) — haze up to 28% acceptable, anti-glare priority
- 100–150 PPI (industrial HMI, ATM) — haze 8–18%, balanced readability
- 150–200 PPI (tablets, automotive) — haze 4–10%, clarity priority
- >200 PPI (medical, high-res mobile) — haze below 5%, minimum scatter
When the application environment is used in indoor controlled lighting, a lighter etch (higher gloss, lower the haze) preserves image clarity while maintaining adequate light for the display. When the panel is suitable for outdoor direct-sunlight environments, accept the heavier etch and compensate with higher display backlight brightness — typically 700–1,000 nits for readable outdoor kiosk performance.
Frequently Asked Questions
Q: What is the spectral transmittance of AG glass?
View Answer
Spectral transmittance of AG glass refers to the percentage of light transmitted at each wavelength across the visible spectrum (380–700 nm). Commercial AG glass panels typically show 88–93% total luminous transmittance when measured per ASTM D1003. The spectral curve is generally flat across visible wavelengths, with slight attenuation at shorter wavelengths (blue, 400–450 nm) due to surface scattering effects. Spectral transmittance data is measured using a spectrophotometer (ASTM D1003 Procedure B) rather than a hazemeter. When evaluating AG glass for color-critical applications like medical imaging, always request the full spectral curve rather than a single-number summary to verify uniform transmission across all visible wavelengths.
Q: What is the difference between haze and transmittance in AG glass?
View Answer
Transmittance measures total light passing through as a percentage of incident light. Haze measures what portion of that transmitted light scatters more than 2.5° off the straight-through beam. Both are measured per ASTM D1003. Transmittance affects brightness; haze affects image sharpness.
Q: How do you test AG glass optical parameters?
View Answer
Three instruments handle the job. A haze meter covers transmittance and haze per ASTM D1003. A glossmeter reads specular gloss at 60° per ISO 2813. A profilometer traces surface roughness Ra per ISO 4287. DOI requires an instrument calibrated to ASTM D5767. Always test five points per panel and average the result.
Q: Can AG glass transmittance specifications be adjusted for custom applications?
View Answer
Yes. AG glass transmittance specifications are controlled by adjusting etching depth, acid concentration, and dwell time during chemical processing. Reducing etch depth by 0.01 mm typically raises transmittance by 0.5–1.0 percentage point, depending on acid level. For projects with both high transmittance and high anti-glare, some makers will combine a light-etch AG treatment with a separate AR (anti-reflective) coating to recover optical parameter loss. Custom specs normally require minimum quantities of 100-500 panels per version depending on the manufacturer.
Q: What is the relationship between gloss and surface roughness in AG glass?
View Answer
Gloss and surface roughness in AG glass have an inversely proportional relationship. As Ra (surface roughness) increases from 0.05 µm toward 1.5 µm, 60° gloss drops from 130+ GU toward 10 GU, because rougher surfaces scatter reflected light into wider angles instead of reflecting it specularly. Engineers use this relationship as a shortcut: specifying a gloss value automatically constrains the achievable roughness range, simplifying procurement by reducing a multi-variable specification to a single control parameter.
Q: How does glass thickness affect AG glass transmittance?
View Answer
Thicker glass absorbs more light. A 1.1 mm panel reads 91–93% transmittance; a 4.0 mm panel of identical etch drops to 88–90%. Roughly 0.5–1.0 percentage point per extra millimeter. Pick the thinnest substrate that still meets mechanical strength needs. Chemically tempered 0.7 mm AG glass balances high transmittance with impact resistance for handheld medical devices.
Do you need AG glass panels with particular transmittance, haze and gloss parameters for your project?
About This Analysis
This technical reference was developed by the Saiweiglass engineering team based on optical testing data from our AG glass production line and published measurement standards including ASTM D1003, ISO 2813, and ISO 4287. The transmittance and haze ranges cited in the application selection matrix reflect parameter combinations we have validated across panel shipments for medical, industrial, and outdoor display projects over the past three years. Measurement protocols follow the instrument calibration procedures described in NIST measurement assurance guidelines for spectrophotometric testing.
References & Sources
- ASTM D1003 — Standard Test Method for Haze and Luminous Transmittance of Transparent Plastics — ASTM International
- ASTM D5767 — Standard Test Method for Instrumental Measurement of Distinctness-of-Image (DOI) Gloss — ASTM International
- ASTM E430 — Standard Test Methods for Measurement of Gloss of High-Gloss Surfaces — ASTM International
- Measurement Assurance Program Transmittance Standards for Spectrophotometric Linearity Testing — National Institute of Standards and Technology (NIST)
- ISO 2813 — Paints and Varnishes: Determination of Gloss Value at 20°, 60° and 85° — International Organization for Standardization