Get in Touch with Saiweiglass



Updated November 2026
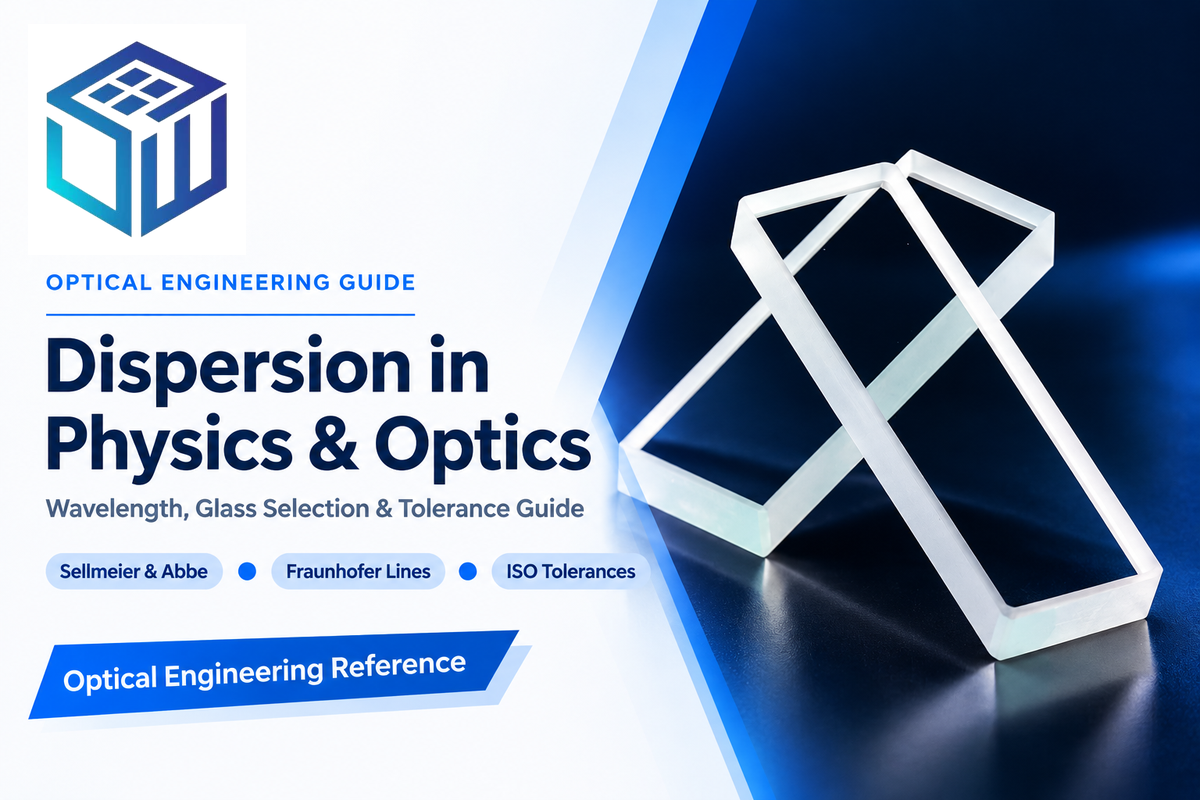
Dispersion is the phenomenon in physics and optics in which the phase velocity of a wave depends on its frequency, causing the refractive index of a transparent medium to vary with the wavelength of light. When white light enters a glass prism, shorter violet wavelengths experience a higher index of refraction and bend through larger angles of refraction than longer red wavelengths.
A basic physics class often demonstrates the spreading of white light into a rainbow. However, for optical engineering, one requires an adequate control over every wavelength across the working spectrum. Depending on whether the component is an imaging lens, a spectrometric prism, or a flat protective window, wavelength-dependent refraction can either create chromatic aberration that must be balanced, or can provide angular separation that must be maximized. This information helps create the physical equations of light dispersion, and in turn helps design glass, select a substrate, and control the drawing tolerance for custom optical glass solutions.
What Is Dispersion in Physics and Optics?
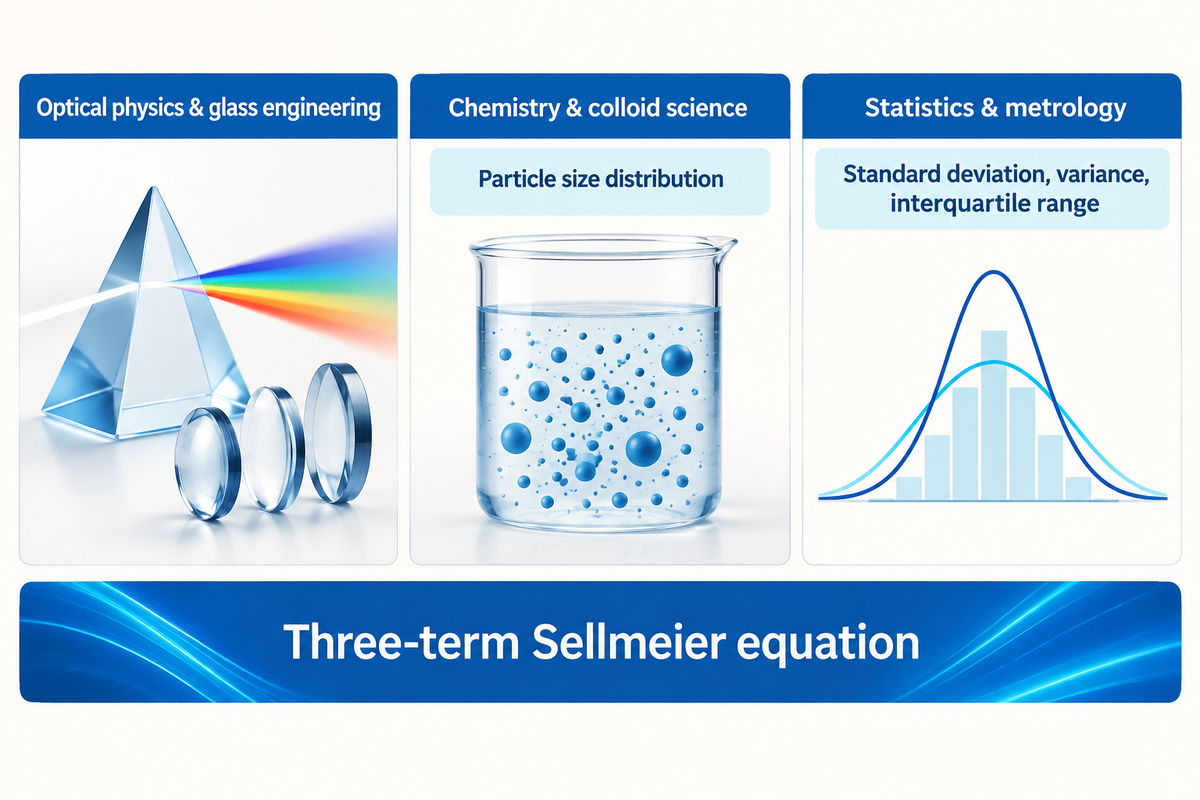
Optical dispersion occurs as electromagnetic radiation interacts with bound electrons in a dielectric medium, making the phase velocity of that medium, vp = c/n (λ), a continuous function of wavelength. Elsewhere in science and industry, dispersion refers to two-phase chemical mixtures of dispersed particles and statistical measures of data distribution around a central value.
What is meant by the term dispersion?
In optics, dispersion describes the wavelength-dependent variation of refractive index in a transparent substance, causing different colors in a beam of light to travel at different speeds and refract into different directions. Chemically, dispersion is a two-phase system in which fine particles or droplets are evenly distributed in a continuous medium. In statistics, dispersion describes the variation in a dataset around the central value, using standard deviation or variance.
Separating these meanings is the starting point in specification. A procurement or quality document referencing dispersion without specifying optical Abbe number, colloidal particle size distribution, or statistical variance is ambiguous, resulting in cross-disciplinary confusion. For an introduction to the single wavelength case of Snell’s law (prior to the splitting of polychromatic light) see the refractive index of glass.
| Discipline | Physical or mathematical mechanism | Primary parameters | Typical engineering application |
|---|---|---|---|
| Optical physics & glass engineering | Frequency-dependent phase velocity vp = c/n(λ) in a dielectric medium | Principal dispersion (nF − nC), Abbe number Vd, partial dispersion Pg,F | Achromatic lenses, dispersing prisms, optical fibers, and sensor windows |
| Chemistry & colloid science | Dispersed particles or liquid droplets suspended throughout a continuous phase | Particle size distribution, zeta potential, flocculation stability | Ceramic slurries, polishing compounds, optical coatings, and emulsions |
| Statistics & metrology | Spread of measured values around a mean or median across a sample | Standard deviation, variance, interquartile range | Incoming batch inspection and melt-to-melt refractive index tracking |
Within optical glass engineering, two empirical equations model how the refractive index changes with wavelength as different colors travel at different speeds and bend in different directions. As documented in the University of Arizona OPTI-421/521 dispersion equation reference, the earliest model is the Cauchy equation, which dates back to 1836 and expresses refractive index as an inverse power series of wavelength (n(λ) = A + B/λ2 + C/λ4). While useful for introductory visible-light approximations, Cauchy’s series diverges near ultraviolet and infrared absorption edges.
In design and glass catalogs, the Sellmeier equation, which is used over the Cauchy equation for predicting the optical constants for glass across the spectral region from the UV to 2.3 μm is expressed as:
Three-term Sellmeier equation: n2(λ) − 1 = B1λ2/(λ2 − C1) + B2λ2/(λ2 − C2) + B3λ2/(λ2 − C3)
Here λ is the vacuum wavelength expressed in micrometers, B 1,2,3 are dimensionless oscillator strengths, and C 1,2,3 represent the squared resonance wavelengths in the ultraviolet and infrared regions. Because the Sellmeier formulation models physical resonance poles, it interpolates refractive index to six decimal places across transparent glass passbands.
Quantifying Optical Dispersion: Principal Dispersion, Abbe Number, and Partial Dispersion
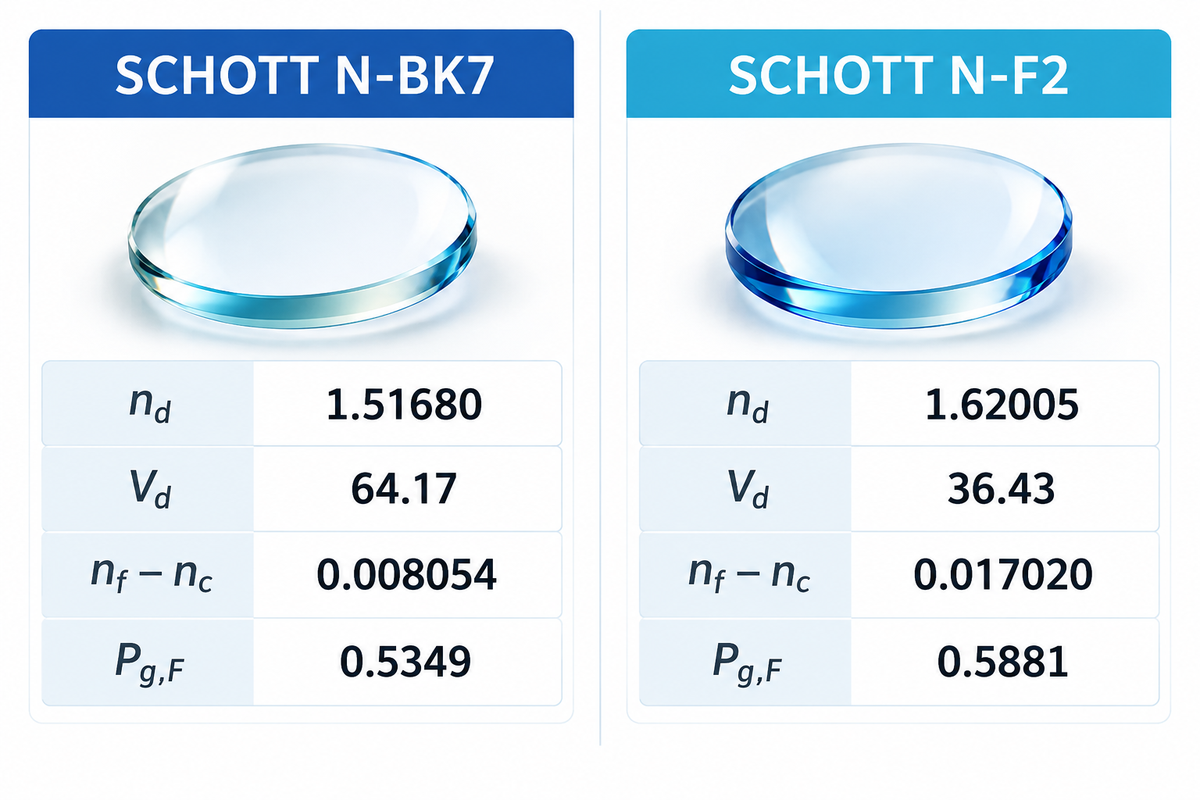
Dispersion is quantified by optical engineers at defined Fraunhofer spectral lines, not by an isolated refractive index. The main dispersion is given by the index difference nF − nC between 486.1 nm and 656.3 nm, while the Abbe number Vd = (nd − 1)/(nF − nC) defines the ratio of refractivity and principal dispersion.
Because this phenomenon makes the refractive index of a substance dependent on the wavelength of light, every catalogue number must be paired with its spectral reference line. In SCHOTT’s N-BK7 datasheet and SCHOTT’s N-F2 datasheet, the yellow helium d-line is at 587.6 nm, the green mercury e-line is at 546.1 nm, the blue hydrogen F-line is at 486.1 nm, the red hydrogen C-line is at 656.3 nm and the violet mercury g-line is at 435.8 nm.
A higher Abbe number means lower dispersion. For the most part, crown glasses exhibit Vd ≥ 50 or Vd ≥ 55 (depending on catalogue convention), while flint glasses exhibit lower Vd, with Vd < 50. For a more detailed comparison, check out our crown glass vs flint glass comparison guide. When designs are referenced to the green mercury line at 546.1 nm instead of the helium d-line, engineers use the Abbe number Ve = (ne − 1)/(nF′ − nC′).
| Optical property and Fraunhofer reference | SCHOTT N-BK7 | SCHOTT N-F2 | Engineering significance |
|---|---|---|---|
| Refractive index nC (656.3 nm, red H) | 1.51432 | 1.61506 | Long-wavelength visible reference boundary |
| Refractive index nd (587.6 nm, yellow He) | 1.51680 | 1.62005 | Standard base index for visible focal power |
| Refractive index ne (546.1 nm, green Hg) | 1.51872 | 1.62408 | Alternate mercury reference line for Ve |
| Refractive index nF (486.1 nm, blue H) | 1.52238 | 1.63208 | Short-wavelength visible reference boundary |
| Refractive index ng (435.8 nm, violet Hg) | 1.52668 | 1.64209 | Violet reference for secondary spectrum control |
| Principal dispersion nF − nC | 0.008054 | 0.017020 | N-F2 spreads blue-to-red index more than twice as strongly as N-BK7 |
| Abbe number Vd (dimensionless) | 64.17 | 36.43 | Reciprocal dispersive power at the d-line |
| Abbe number Ve (dimensionless) | 63.96 | 36.16 | Reciprocal dispersive power at the e-line |
| Relative partial dispersion Pg,F | 0.5349 | 0.5881 | Measures blue-violet curvature (ng − nF)/(nF − nC) |
| Internal transmittance τi (1060 nm, 10 mm) | 0.999 | 0.998 | High near-IR bulk transparency for both grades |
Vd describes the average slope between 486.1 nm and 656.3 nm, and doesn’t indicate how rapidly the index curve bends in the violet or near-UV. Relative partial dispersion, P g, F = (n g – n F )/(n F – n C ) describes how rapidly the curve bends. Two glasses of complementary Abbe numbers will always leave a residual color error if their partial dispersions don’t also agree. Catalogue refractive indices and Abbe numbers apply to specific named grades and reference spectral lines (d-line at 587.6 nm vs e-line at 546.1 nm), not to an entire glass family.
Normal vs. Anomalous Dispersion Across the Electromagnetic Spectrum
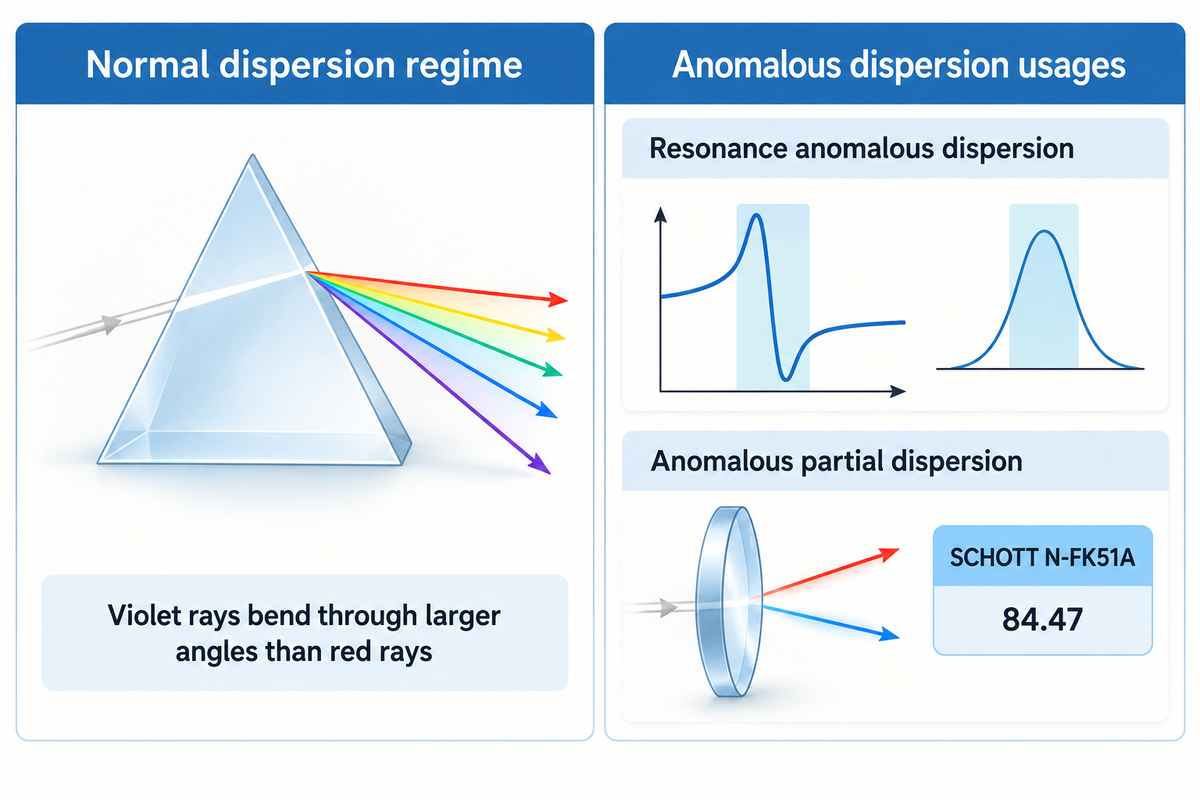
Under normal dispersion, the refractive index decreases monotonically with increasing wavelength (dn/dλ < 0, or dn/dω > 0 with frequency), so violet light refracts more strongly than red light. Anomalous dispersion refers either to resonance absorption regions where dn/dλ > 0 or to transparent glasses whose partial dispersion Pg,F departs from the normal glass line.
Normal dispersion regime (dn/dλ < 0)
- Occurs across the transparent passband between ultraviolet electronic resonances and infrared lattice vibrations.
- Refractive index increases as wavelength shortens (ng > nF > nd > nC).
- Violet rays bend through larger angles than red rays in a glass prism or inside water droplets during rainbow formation.
Anomalous dispersion usages (two distinct meanings)
- Resonance anomalous dispersion (dn/dλ > 0): occurs inside strong UV or IR absorption bands governed by Kramers-Kronig relations, accompanied by severe attenuation.
- Anomalous partial dispersion (ΔPg,F ≠ 0): transparent fluorite or phosphate glasses that remain in normal dispersion (dn/dλ < 0) but deviate from the standard linear Pg,F vs. Vd line.
Misunderstanding anomalous dispersion in this way is a common cause of specification errors. Based on the fundamentals of electromagnetism, the Kramers-Kronig relations connect the real part of the refractive index (n(ω)) with the extinction coefficient (κ(ω)). Near the ultraviolet (UV) band edge of an electronic transition of a glass or the multiphonon absorption band edge of an infrared (IR) glass, dispersion steepens rapidly and changes sign. It’s around these absorption bands that glass is no longer able to function as a low-loss transmissive optic.
Throughout lens design catalogues and optical glass patents such as CN104909559A, however, “anomalous dispersion glass” means a transparent substrate with non-zero partial dispersion deviation ΔPg,F. As RP Photonics notes in its crown glass reference, crown glasses are conventionally defined above an Abbe threshold of 55 or 50, and specialty fluorite crowns such as SCHOTT N-FK51A (nd = 1.48656, Vd = 84.47 in SCHOTT TIE-19 Table 1) provide positive anomalous partial dispersion to cancel secondary spectrum. Normal and resonance anomalous dispersion describe bulk material behavior relative to absorption bands, whereas anomalous partial dispersion (ΔPg,F) describes curvature deviation within a transparent window.
Material Dispersion vs. Waveguide Dispersion in Optical Fibers and Windows
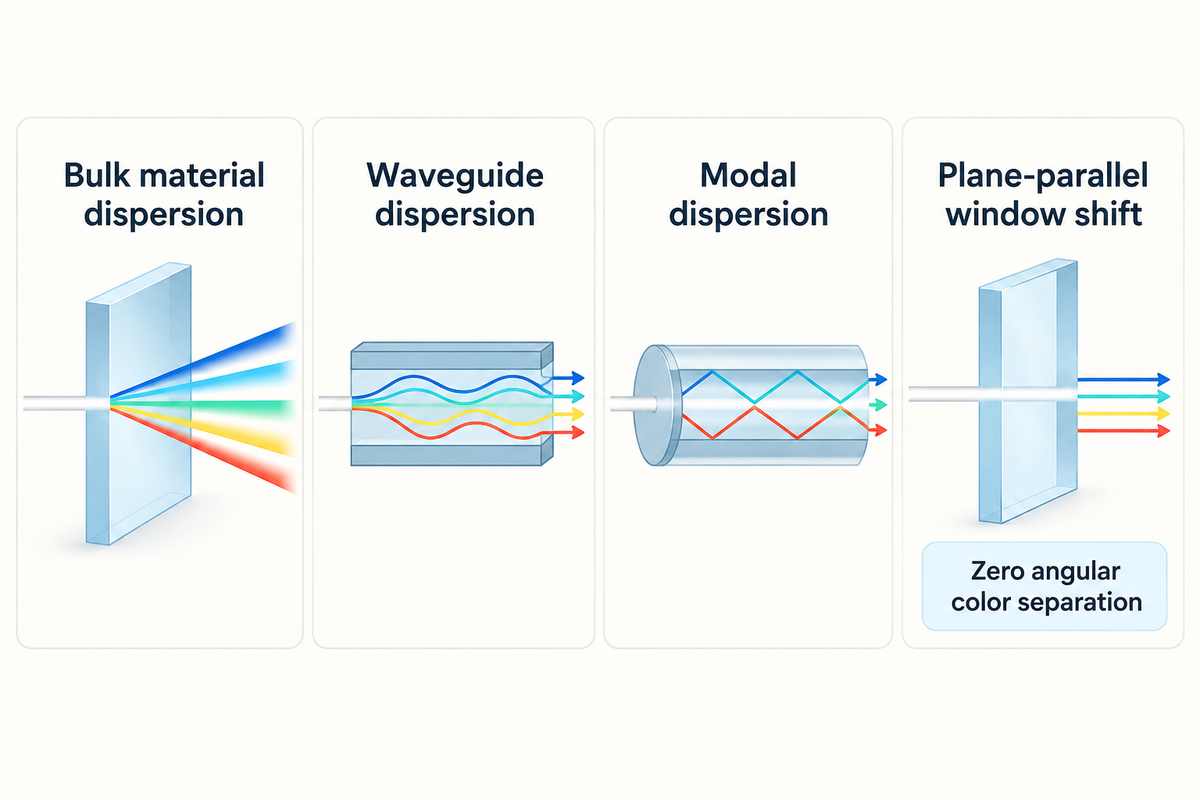
Material dispersion arises from the bulk glass composition through the second derivative of refractive index with wavelength (d2n/dλ2), whereas waveguide dispersion occurs because an optical fiber’s core-cladding geometry distributes mode energy differently across wavelengths. Across flat parallel windows, refraction produces small lateral ray shifts as opposed to angular color splitting.
What is chromatic dispersion in optical fiber and what are its implications?
Chromatic dispersion in an optical fiber is the combined pulse broadening caused by material dispersion and waveguide dispersion as different wavelengths within a laser or LED signal travel at different group velocities along the core. Its primary effect is temporal spreading of pulses (ps/(nm · km)) which merges adjacent digital pulses, constrains the bit rate and transmission distance in single-mode fiber links. If not compensated, dispersion chirps ultrashort laser pulses.
Within bulk fused silica modeled by the Sellmeier dispersion representation, material dispersion passes through zero near 1.27 μm to 1.31 μm, where d2n/dλ2 = 0. By tailoring core diameter and refractive index profile, fiber designers shift the waveguide dispersion contribution to create dispersion-shifted or dispersion-flattened optical fibers. Multimodal fibers additionally experience modal dispersion, which is a multipath geometric delay among propagation modes rather than a wavelength-dependent refractive index effect.
| Mechanism | Physical origin | Governing parameter | Component design impact |
|---|---|---|---|
| Bulk material dispersion | Wavelength-dependent electronic and lattice polarizability of the glass substrate | dn/dλ, Abbe number Vd, and d2n/dλ2 | Sets prism angular spread, lens chromatic focal shift, and ultrafast group velocity dispersion |
| Waveguide dispersion | Wavelength-dependent fraction of mode power propagating in fiber cladding vs. core | Core radius, numerical aperture, and effective mode index neff(λ) | Shifts zero-dispersion wavelength in single-mode optical fibers |
| Modal dispersion | Different axial path lengths of low-order and high-order modes at a single wavelength | Step-index vs. graded-index core profile | Controlled by graded-index profiles or single-mode cutoff, not Abbe number |
| Plane-parallel window shift | Equal and opposite Snell’s law refraction at parallel entry and exit faces | Window thickness t, incidence angle θi, and wedge angle | Zero angular color separation; only microscopic lateral ray offset at oblique incidence |
For instrument windows and display cover glass, the last row of this table prevents unnecessary material cost. At any single glass-air boundary, the angle of refraction depends on wavelength. However, when a ray of light enters a flat window with parallel faces at an oblique angle, the second face cancels the angular bend of the first face. Uniform sheet thickness ensures that the surfaces transmit the beam along its original direction with a small lateral offset. Only with the presence of a non-zero wedge angle or curvature of a lens does angular deviation in a beam of light introduce angular chromatic dispersion.
Chromatic Aberration Control: Prisms, Achromatic Doublets, and Apochromats
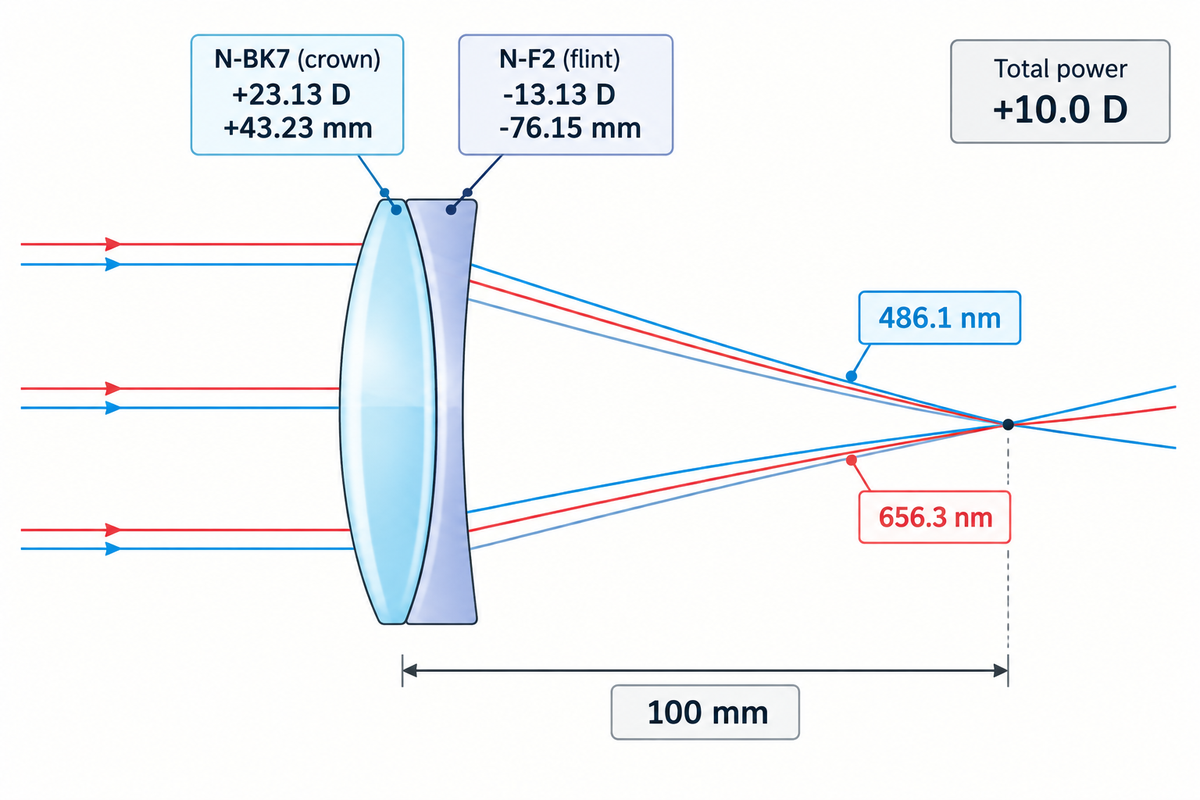
Within a dispersing prism, non-parallel faces amplify dn/dλ into angular separation of light for spectroscopy; for imaging, the same dispersion of light creates longitudinal and lateral chromatic aberration. A conventional achromatic doublet pairs a positive low-dispersion crown element with a negative high-dispersion flint element to bring two different wavelengths to a common focus.
Longitudinal chromatic aberration can be observed in the case of off-axis light rays in the presence of sunlight. Similarly, in nature, sunlight entering spherical water droplets undergoes refraction, internal reflection, and angular dispersion in rainbow formation. In a spectrometer prism, the designer needs to maximize angular colour, and in other optical instruments, the designer needs to minimize focal shift and eliminate angular colour. A recent analysis of aberrations in lenses by Photonics Spectra provides insight into the ways designers maximize or minimize focal shift within a given optical instrument.
“Only two wavelengths can have the same focus (see Figure 3), and the remaining secondary spectrum produces greenish or purple fringes on images of sharp edges.”
Using the thin-contact achromatic equations from the University of Arizona OPTI-502 chromatic-effects notes, a designer divides total optical power Φ = 1/f between two elements so that their powers add (Φ1 + Φ2 = Φ) while their chromatic contributions cancel (Φ1/V1 + Φ2/V2 = 0):
Worked 100 mm Achromatic Doublet Verification (Assumed Teaching Example):
Target: Total focal length f = 100 mm (0.100 m), total optical power Φ = +10.0 D, pairing SCHOTT N-BK7 crown (V1 = 64.17) with SCHOTT N-F2 flint (V2 = 36.43).
Crown power Φ1: Φ × V1/(V1 − V2) = 10.0 × 64.17/(64.17 − 36.43) = +23.13 D → focal length f1 = +43.23 mm.
Flint power Φ2: −Φ × V2/(V1 − V2) = −10.0 × 36.43/(64.17 − 36.43) = −13.13 D → focal length f2 = −76.15 mm.
This yields a two-element design for a doublet that focuses the blue F-line (486.1 nm) and the red C-line (656.3 nm) to a common paraxial position. Green-Yellow wavelengths remain slightly out of focus, as residual secondary spectrum. To achieve a common focus for all three wavelengths, a design consisting of three elements, or an apochromat, is required. This type of design generally requires a pair of glasses (or a triple) with matched relative partial dispersion P g, F , similar to pairing an anomalous dispersion fluorite crown with a CaF 2 crystal element. The calculation for thin-contact achromats disregards various design factors, such as the thickness of the lenses, the air gaps between them, and higher-order spherochromatism, thereby requiring final prescription designs and full ray-tracing to complete the design.
Engineers should also separate bulk substrate dispersion from surface coating interference. Anti-reflective coatings reduce Fresnel surface reflections through thin-film interference, and don’t affect the glass substrate’s internal n(λ) or axial focal shift. For more information, please visit how anti-reflective coatings work.
Selecting Optical and Cover Glass Substrates with the Fraunhofer-Line Dispersion Selector
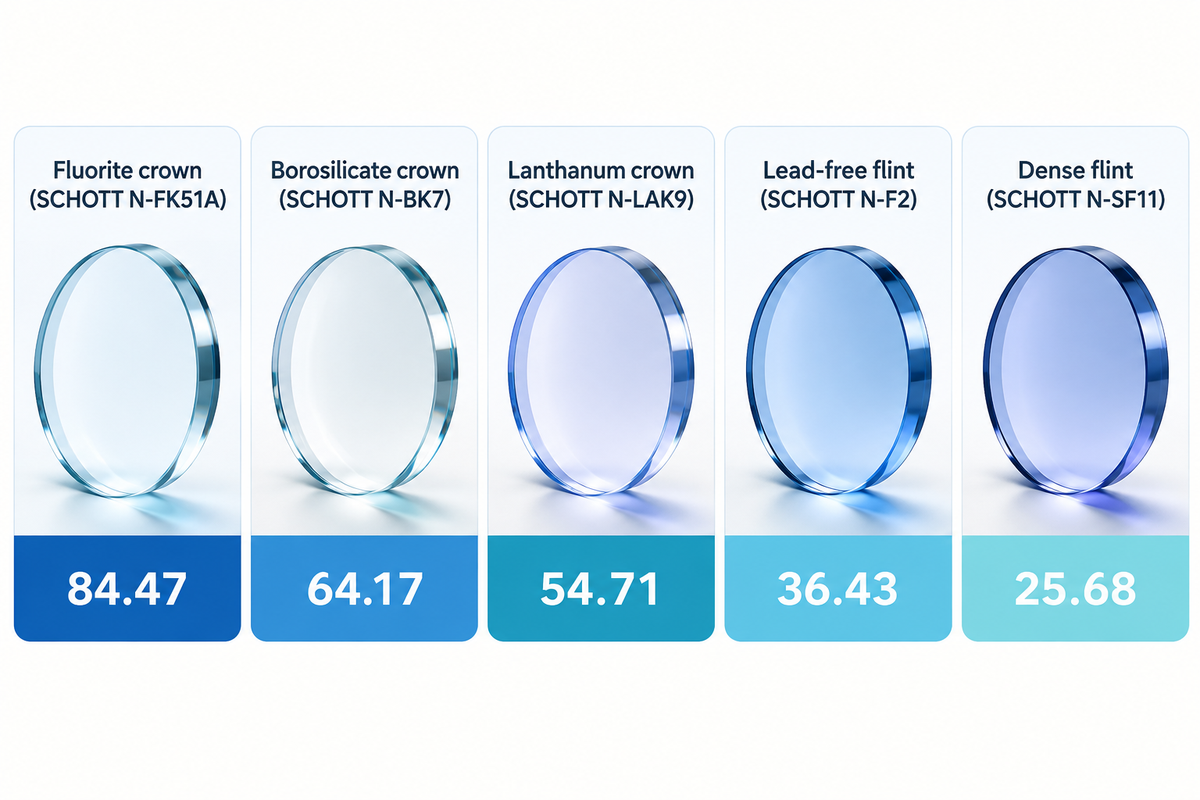
Use the Fraunhofer Line Dispersion Selector to match the optical or protective glass family’s refractive index nd, Abbe number Vd, and partial dispersion behavior with the function of the component. Zero-power protective cover windows prioritize transmittance and surface hardness and durability, while negative spectrometric elements and prisms use high-dispersion flints.
8-Substrate Fraunhofer-Line Dispersion Selector
Per SCHOTT’s TIE-19 Table 1, optical grades span from fluorite crown N-FK51A (nd = 1.48656, Vd = 84.47) and borosilicate crown N-BK7 (nd = 1.51680, Vd = 64.17) to lanthanum crown N-LAK9 (nd = 1.69100, Vd = 54.71), flint N-F2 (nd = 1.62005, Vd = 36.43), and dense flint N-SF11 (nd = 1.78472, Vd = 25.68). Notice that N-LAK9 has a higher refractive index than N-F2 while retaining a crown-class Abbe number above 54, proving that high refractive index and high dispersion don’t always move together. For detailed family descriptions, as well as dispersion and transmission curves, view our BK7 Optical Glass Properties reference, and for broader information and other families view our Optical Glass Types and Properties reference.
| Substrate family / reference grade | Catalogue nd & Vd | Dispersion profile | Primary optical or window application | Disqualifier condition |
|---|---|---|---|---|
| Fluorite crown (SCHOTT N-FK51A) | nd = 1.48656, Vd = 84.47 | Ultra-low dispersion; positive anomalous ΔPg,F | Apochromatic objectives and secondary-spectrum correction | Higher thermal expansion and delicate grinding/polishing behavior |
| Fused silica (amorphous SiO2) | Low-index UV/NIR silica family | Low visible dispersion; deep-UV and NIR transparency | UV excimer/laser optics, high-power windows, low-CTE references | Unnecessary substrate cost when standard visible crown meets thermal/spectral spec |
| Borosilicate crown (SCHOTT N-BK7) | nd = 1.51680, Vd = 64.17 | nF − nC = 0.008054, Pg,F = 0.5349 | Visible singlets, positive achromat elements, right-angle prisms, precision windows | Deep-UV throughput drops below 350 nm (0.967 at 10 mm) |
| Lanthanum crown (SCHOTT N-LAK9) | nd = 1.69100, Vd = 54.71 | High refractive index paired with moderate crown dispersion | Compact imaging lenses requiring reduced surface curvature and spherical aberration | Higher material cost and chemical sensitivity than standard borosilicate crown |
| Lead-free flint (SCHOTT N-F2) | nd = 1.62005, Vd = 36.43 | nF − nC = 0.017020, Pg,F = 0.5881 | Negative corrective element in visible achromatic doublets and dispersing prisms | Strong near-UV absorption at 350 nm makes it unsuitable for UV optics |
| Dense flint (SCHOTT N-SF11) | nd = 1.78472, Vd = 25.68 | Very high principal dispersion and high refractive power | High-resolution prism spectrometers and compact flint correctors | Steep blue-violet absorption and higher Fresnel reflection without AR coating |
| Aluminosilicate cover glass | Chemically strengthened sheet glass | Zero angular dispersion in flat parallel geometry | Outdoor, marine, and automotive display cover panels requiring impact resistance | Not melted to ISO 12123 optical-lens homogeneity or melt-sheet Vd steps |
| Ultra-clear soda-lime float glass | Low-iron flat float sheet | Zero angular dispersion in plane-parallel cover windows | Cost-effective protective windows, touch panels, and instrument covers | Disqualified for powered imaging lenses requiring tight nd and Vd tolerances |
Specifying Dispersion Tolerances and Melt Certificates (ISO 10110-1 & ISO 12123)
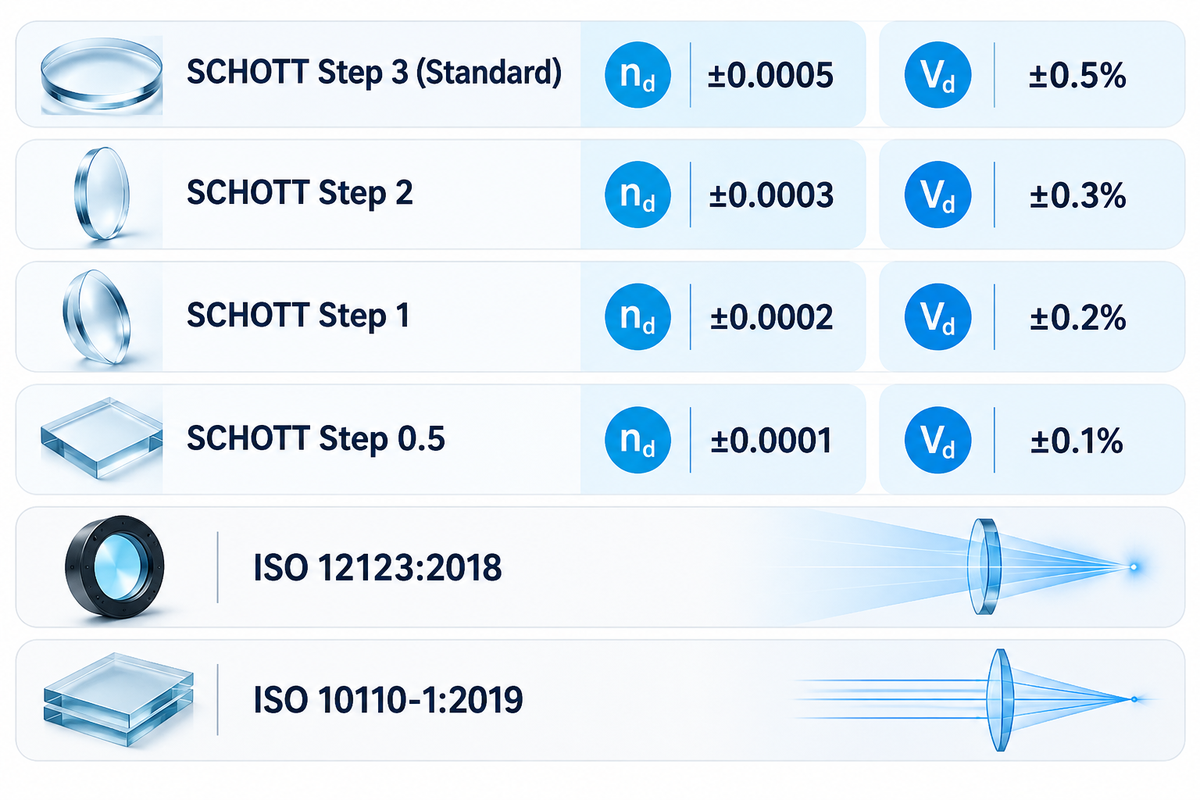
Specify raw optical glass blank dispersion tolerances under ISO 12123:2018 and finished element drawing notations under ISO 10110-1:2019. Within SCHOTT’s TIE-29 specification system, standard delivery (Step 3) permits ±0.0005 on refractive index nd and ±0.5% on Abbe number Vd, while precision steps tighten Vd down to ±0.1%.
Properties of optical glass vary from melt to melt, and are also dependent upon the cooling rate of the annealing process. ISO 12123:2018 (last reviewed and confirmed in 2024) defines how raw optical glass blanks are characterized, whereas ISO 10110-1:2019 (last reviewed and confirmed in 2025) establishes the drawing notation for finished optical elements, including stress birefringence, bubbles, and striae.
According to SCHOTT Technical Information TIE-29 on refractive index and dispersion, catalogue values pertain to a reference annealing rate, and lot to lot deviations are controlled through four tolerance steps for 20 mm test samples.
| Tolerance class / standard | Refractive index nd tolerance | Abbe number Vd tolerance | Verification & production protocol |
|---|---|---|---|
| SCHOTT Step 3 (Standard) | ±0.0005 | ±0.5% | Standard catalogue delivery for general lenses, prisms, and windows |
| SCHOTT Step 2 | ±0.0003 | ±0.3% | Tightened batch selection for multi-element imaging assemblies |
| SCHOTT Step 1 | ±0.0002 | ±0.2% | Precision optics; verify batch melt certificate before grinding |
| SCHOTT Step 0.5 | ±0.0001 | ±0.1% | High-NA objectives and metrology optics; re-fit radii to melt sheet |
| ISO 12123:2018 (confirmed 2024) | Raw glass blank specification | Principal & partial dispersion classes | Measured by V-block refractometer or precision minimum-deviation goniometer |
| ISO 10110-1:2019 (confirmed 2025) | Drawing material indication | Element-level tolerance callout | Links substrate grade to surface form, centering, and coating acceptance |
To observe whether a batch meets Step 1 or Step 0.5 limits, glass manufacturers measure test prisms using V-block refractometry (typical uncertainty ±3×10⁻⁵ to ±5×10⁻⁵) or precision goniometer spectrometers (±5×10⁻⁶) and supply a melt sheet listing actual Sellmeier constants so lens designers can re-space or re-radius elements before fabrication. ISO 12123:2018 governs raw optical glass blanks while ISO 10110-1:2019 governs finished optical element drawings; neither standard replaces lot-specific melt certificates when Step 1 or Step 0.5 tolerances are required. For finished component dimensional and optical verification, see SW Glass’s glass quality inspection scope.
Cost Drivers and Custom Glass Fabrication Handoff
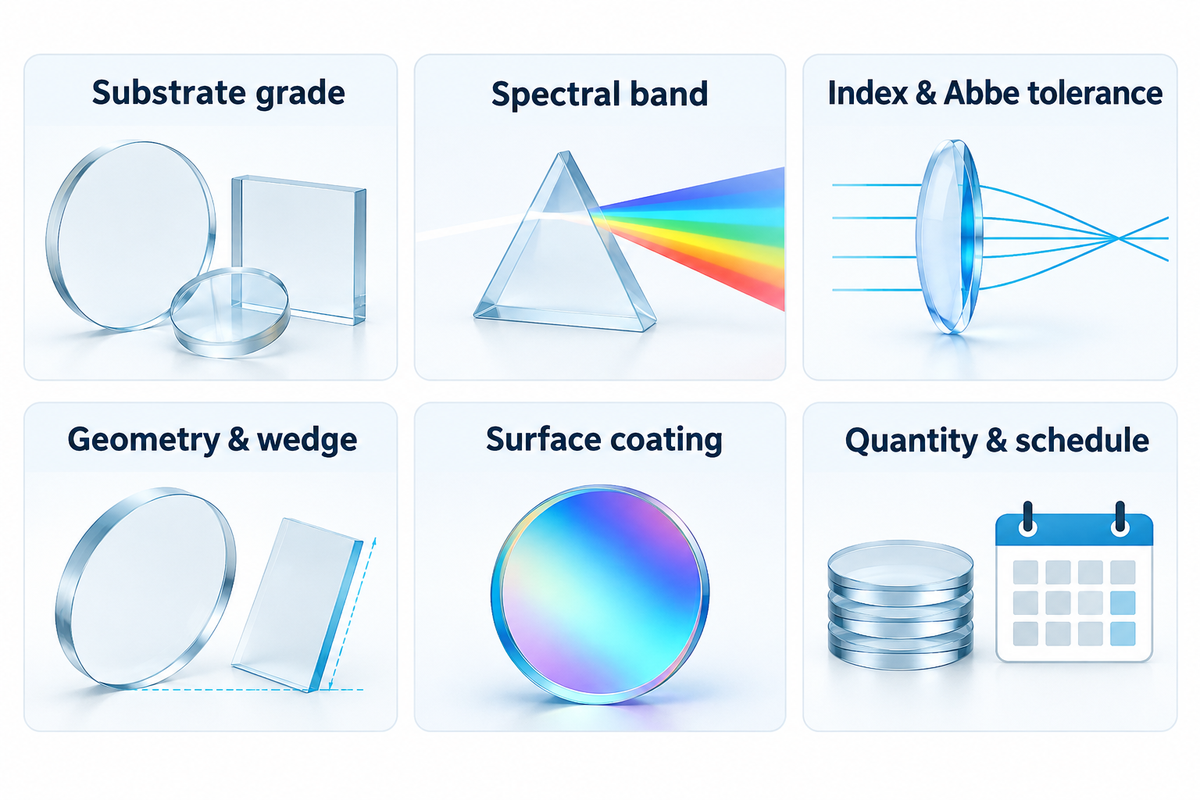
Custom optical and cover glass pricing is dictated primarily by availability of raw blanks, and tolerance class of dispersion, as well as the limits of wedge and flatness, and the complexity of thin-film coatings. Abbe Number is of little importance in setting price. Normalize the substrate designation, ISO drawing tolerances and spectral passband on one revision before comparing pricing.
According to Bill Thames in Photonics Spectra’s optical glass selection guide, assuming all catalog glasses have equal availability, or over specifying tight dispersion tolerances when standard Step 3 blanks suffice, can result in increased lead times and additional tooling costs. Separately, SCHOTT’s January 2026 positive list commits to keeping listed lead-free N- and P-glasses available for at least five years, but manufacturer melt frequency still differs between high-volume N-BK7 and specialty lanthanum or fluorite grades.
Same-drawing quotation comparisons evaluate manufacturing and tolerance cost, whereas substituting a different glass grade requires optical redesign to preserve focal length and chromatic balance. Use the checklist below, when preparing a custom window, prism, or cover glass RFQ for AR and AF coating services.
| Specification field | Required drawing input | Why it affects dispersion or cost | Verification document |
|---|---|---|---|
| Substrate grade | Exact catalogue grade (e.g., SCHOTT N-BK7, N-F2, fused silica, or aluminosilicate) | Prevents generic crown/flint or soda-lime substitution | Raw glass certificate and RoHS/REACH declaration |
| Spectral band | Operating wavelength range in nm or μm (e.g., 435.8–656.3 nm or 1060 nm) | Fixes reference Fraunhofer lines and internal transmittance check | Spectrophotometer transmission curve |
| Index & Abbe tolerance | Standard Step 3 vs. precision Step 1 or Step 0.5 melt data | Determines whether custom melt selection or radius refitting is needed | Batch melt sheet per ISO 12123 |
| Geometry & wedge | Thickness in mm, curvature radii, and parallelism/wedge angle tolerance | Unintended wedge in a flat window introduces angular beam deviation | Dimensional and interferometric inspection report |
| Surface coating | AR, AG, or AF coating band, incidence angle, and average reflectance limit | Controls surface Fresnel reflection without changing bulk dispersion | Coating witness sample reflectance trace |
| Quantity & schedule | Prototype count, production batch size, and target delivery window | Separates one-time CNC/coating setup charges from unit price | Itemized supplier quotation |
Frequently Asked Questions
Why does violet light bend more than red light during dispersion in a glass prism?
Violet light has a shorter wavelength and higher frequency that lie closer to the ultraviolet electronic resonance absorption bands of optical glass. Under normal dispersion (dn/dλ < 0), this stronger oscillator interaction reduces violet phase velocity, raises its refractive index relative to red light across the visible passband, and produces a measurably larger Snell’s law refraction angle at both entry and exit prism faces during spectroscopy.
Does dispersion split white light into a rainbow when passing through a flat parallel glass window?
No angular rainbow splitting occurs through a plane-parallel glass window surrounded by air. Although oblique white light refracts into slightly different internal angles at the entry surface, the parallel exit surface bends every wavelength back parallel to the original incident ray, producing only a microscopic lateral shift rather than angular color separation.
What is the difference between dispersion and diffraction in optical instruments?
Dispersion separates wavelengths by refraction through a medium whose refractive index varies with wavelength (dn/dλ), bending short-wavelength violet light more strongly than red light. Diffraction separates wavelengths by wave interference across periodic grating grooves (d sinθ = mλ), which bends longer red wavelengths through larger angles than shorter violet wavelengths.
How is an Abbe number related to optical dispersion?
The Abbe number Vd = (nd − 1)/(nF − nC) is the reciprocal of dispersive power: higher Vd values indicate lower optical dispersion.
Can an anti-reflective (AR) coating fix chromatic dispersion in an optical lens or marine display cover glass?
No. Chromatic dispersion is a bulk substrate property governed by the glass’s internal refractive index curve n(λ) and the element’s surface curvatures or wedge angle. An anti-reflective coating operates at the air-glass interface using thin-film interference to reduce surface Fresnel reflection and improve light transmittance across a specified wavelength band without altering bulk focal shift inside an imaging lens.
What is dispersion in chemistry vs. optics?
Chemical dispersion describes fine particles or droplets distributed in a continuous phase, whereas optical dispersion describes wavelength-dependent wave velocity in transparent media.
Request a Custom Optical or Cover Glass Quotation
Send SW GLASS your substrate grade, component drawing, operating wavelength band, and coating requirements to align material selection with CNC machining, tempering, and optical inspection, or contact our engineering team.
Method note: Author Dd. Catalogue refractive indices, Abbe numbers, and tolerance steps are cited from published SCHOTT datasheets, University of Arizona optical engineering notes, and ISO standards. The 100 mm doublet calculation is a paraxial teaching example; no proprietary laboratory refractometry trial is claimed.
References & Sources
- OPTI-421/521: Dispersion Equations James M. Palmer, University of Arizona.
- OPTI-502: Chromatic Effects John E. Greivenkamp, University of Arizona.
- TIE-29: Refractive Index and Dispersion SCHOTT Technical Information, hosted by University of Arizona Optomechanics.
- Chromatic Aberration Florida State University, Molecular Expressions Optical Microscopy Primer.
- ISO 12123:2018: Raw optical glass International Organization for Standardization (confirmed 2024).
- ISO 10110-1:2019: Preparation of drawings for optical elements and systems International Organization for Standardization (confirmed 2025).
- Optical Glass Selection Is Not Always So Transparent a Choice Bill Thames, Photonics Spectra.
- Lens Aberrations: Avoiding Defects in Imagery Photonics Spectra.
- CN104909559A: Optical glass with negative anomalous dispersion and optical element Google Patents.