Get in Touch with Saiweiglass

Updated November 2026 | Reviewed by the Dongguan Saiwei Glass Co., Ltd. technical team
Light behaviors distribute total incident optical power across transmission (T), reflection (R), and absorption (A), where T + R + A = 100% by conservation of energy per the University of Arizona Fresnel reference. On uncoated n = 1.50 glass at normal incidence, first-pass reflection across two bare faces removes 7.84% (excluding internal multiple reflections, per Vanderbilt optics notes), and SW Glass multi-layer sputtered coatings lift two-side visible transmittance above 98%.
Quick Specs: Optical Cover Glass Light Control Benchmarks
| Parameter | Baseline Clear Float (n = 1.5) | Multi-Layer AR Coated | Chemically Etched AG |
|---|---|---|---|
| Visible Light Transmittance (400–700 nm) | 92.16% first-pass (n = 1.50 model) | >98% (SW Glass 2-side spec) | Controlled by etch depth & haze |
| Surface Reflectance per Air-Glass Face | ~4% per face at 0° normal incidence | ≤0.4% VIS 0° AR (Edmund); <0.5% single face (SW Glass) | ~4% per face at 0° normal incidence (scattered off etch) |
| 60° Gloss Rating | Specular finish (~100+ GU ref; 100 GU black glass cal) | Specular finish (varies by stack & substrate) | 35–110 GU at 60° (CNGlassFab etched range) |
| Typical Thickness Range | 0.4–12 mm substrate (no film) | 100 nm–1 µm thin film on glass | 0.4–8.0 mm etched panel |
What Are the Core Light Behaviors When Light Waves Strike Matter?
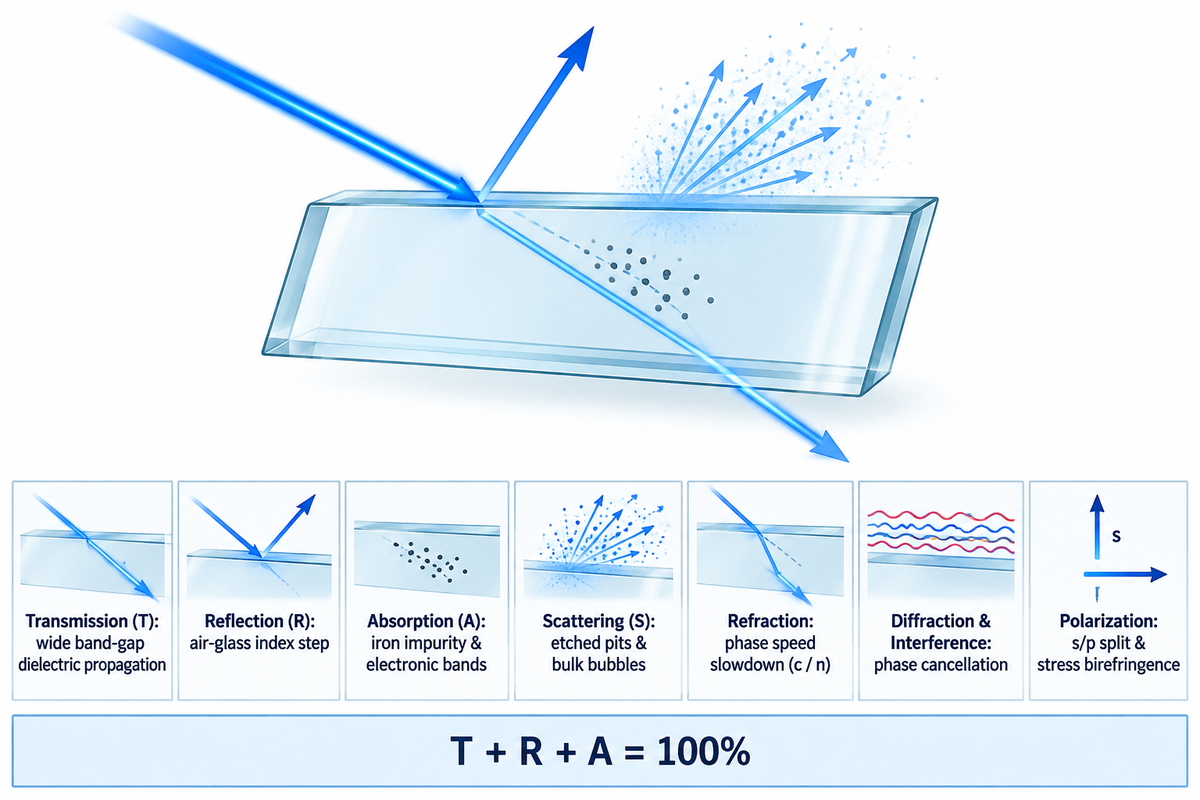
Incident optical power is partitioned into transmission, reflection, and absorption. Transmitted and reflected light can be specular and scattered. In display cover glass engineering, selecting optical glass substrates, surface finishes, and thin-film stacks begins with how electromagnetic waves respond at each air-glass boundary.
For light traveling inside optical glass (n_i = 1.50) toward an external air boundary (n_t = 1.00), Snell’s law sets the total internal reflection threshold at 41.8 degrees, as derived in Delft University of Technology’s optics course.
“It turns out that when θ_i_ > 41.8°, the wave is totally reflected and there is no propagating transmitted wave in air.”
This periodic wave property of light—propagating as coupled electric and magnetic fields driven by an oscillating electric disturbance—slows inside glass in proportion to refractive index n, governing Fresnel reflection, Snell’s law refraction, and thin-film interference boundaries. Each discrete quantum photon in the visible spectrum carries energy with respect to wave-particle duality.
Features of electromagnetic radiation (EMR) shift sharply across bands from millimeter microwave wavelengths to visible optics. Clear silicate substrates pass 400-700 nm visible light and near-infrared rays up to about 2,500 nm (Vanderbilt optics notes), and block ultraviolet wavelengths below 350 nm.
Cover glass buyers use this dual nature of light directly on optical drawings. Wave-like phase behavior governs destructive interference in sputtered AR stacks, and the wave nature of surface texture controls etched AG haze. Specifying whether display backlights or sensor sources emit and control broadband white light or narrow laser bands keeps every wave model and particle-level UV cut-off checks consistent on the print.
What are the four ways light can interact with an object?
Light interacts with matter through reflection, absorption, transmission, and scattering. Many entry level texts list refraction or emission as the fourth category instead of scattering. On real cover glass, refraction bends oblique transmitted light rays, while surface texture and bulk inclusions scatter energy out of the direct forward beam.
Each mechanism shifts energy out of the intended imaging path in a distinct way. Specular reflection sends a beam back off of a polished face to create ghost images. Forward diffuse scattering spreads transmitted light across both narrow angles (reducing edge sharpness) and wide angles beyond 2.5 degrees (measured as ASTM D1003 haze).
Optical Energy Conservation Law: T + R + A = 100% (T = T_direct + T_scatter; R = R_specular + R_diffuse)
Every photon arriving from a light source must pass through (transmit, either straight or scattered), be reflected back (reflection, either specular or diffuse), or converted into heat or re-emission (absorption). Without controlling R or forward scatter, raising backlight brightness is a waste of power.
Bulk absorption A decreases with the use of a low-iron glass melt. An index-matched AR thin-film stack lowers specular reflection R.
| Optical Mechanism | Physical Driver in Medium | Cover Glass Failure Mode | Standard Lab Measurement |
|---|---|---|---|
| Transmission (T) | Forward propagation through wide band-gap dielectric | Dim readout under daylight ambient load | Dual-beam spectrophotometer (VLT %) |
| Reflection (R) | Refractive index step at air-glass boundary | Mirror glare, ghost doubling, washed contrast | 60° glossmeter (GU) and reflectance % |
| Absorption (A) | Electronic transitions or iron impurity bands | Green edge tint and panel thermal rise | Beer-Lambert attenuation coefficient (α) |
| Scattering (S) | Etched microtexture pits or bulk bubbles | Milky haze (>2.5° cone) and pixel sparkle | ASTM D1003 integrating-sphere haze meter |
| Refraction | Phase speed slowdown inside glass (c / n) | Focal shift, off-axis parallax, total internal reflection | Prism coupler refractive index (n at 587.6 nm) |
| Diffraction & Interference | Coherent path-length phase cancellation | Purple or green color shift at 45° viewing | Variable-angle ellipsometry and spectral scan |
| Polarization | s/p vector split and stress birefringence | Blackout bands viewed through polarized sunglasses | Polariscope retardation check (nm/cm) |
Light Transmission Through Glass: Why Visible Light Passes Clear Substrates
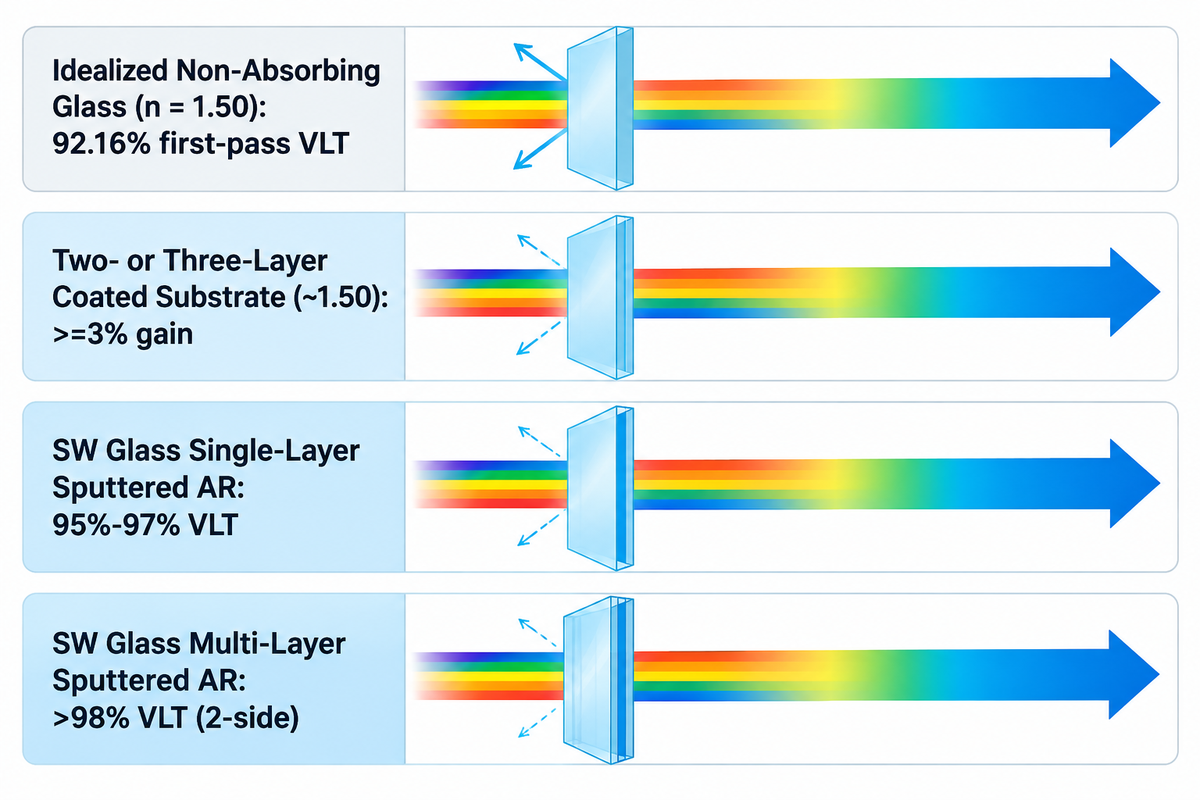
Visible light passes cleanly through silica-based glass because its valence electrons are tightly bound across a wide electronic band gap. A visible photon doesn’t have enough energy to excite an electron across that band gap. For uncoated, non-absorbing glass with n = 1.5 at normal incidence, 92.16% is the first-pass transmittance; total transmittance also includes light emerging after multiple internal reflections. SW Glass reports visible transmittance above 98% for its multilayer AR glass.
Electromagnetic wave propagation slows inside higher-index glass, and bulk impurities can cause the intensity of light to drop. Atoms polarize in response to the incoming wave as light propagates through the glass. Without internal impurities or surface scatter, light intensity stays steady across uniform clear glass.
As path length increases, the presence of trace amounts of iron oxide in float glass creates a green tint. Spectral flatness of low-iron ultra-clear glass, as well as other specialty substrates, is typically better than that of float glass. Check out our optical glass substrate types for better alignment of refractive index and mechanical hardness.
By which process do light rays pass through window glass without losing sharpness?
Light rays pass cleanly through window glass by means of coherent forward transmission rather than random diffusion. Unlike luminescent materials where photons are absorbed and reemitted, clear silica transmits incandescent or LED light with bound electrons oscillating in response to the light.
Frosted glass, for example, with a random-phase texture, breaks phase coherence and scatters rays in all directions. Opaque housings use free electrons in metals or dense absorbing pigment particles to reflect or absorb incident light completely.
| Glass Configuration | Refractive Index (n) | Normal-Incidence VLT | Published Reference |
|---|---|---|---|
| Idealized Non-Absorbing Glass | 1.50 | 92.16% first-pass (0.9216) | Vanderbilt University optics module |
| Two- or Three-Layer Coated Substrate | ~1.50 substrate | ≥3% gain over bare glass | Peer-reviewed lens coating study (archived on PubMed Central) |
| SW Glass Single-Layer Sputtered AR | Low-iron / Aluminosilicate | 95%–97% (total window) | SW Glass single-layer AR product specification |
| SW Glass Multi-Layer Sputtered AR | Low-iron / Aluminosilicate | >98% (2-side coated) | SW Glass multi-layer AR product specification |
Incoming QC engineers distinguish total hemispherical transmission from narrow-beam specular transmission using an integrating sphere and a spectrophotometer. At SW Glass, production lots run on calibrated Konica Minolta spectrophotometers across 400–700 nm to measure finished panels directly.
Reflection of Light and the Law of Reflection at Air-Glass Interfaces
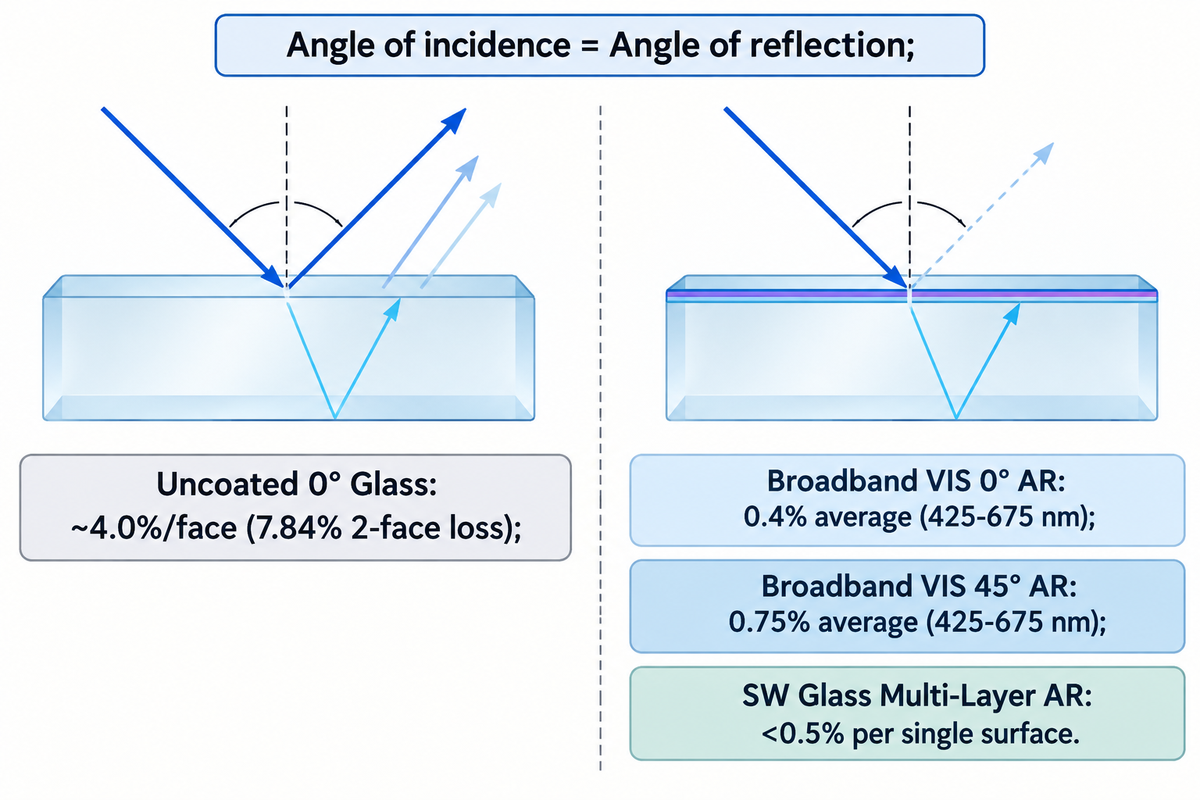
Following those transmission principles, when incident light strikes an uncoated air-glass interface at 0 degrees normal incidence, approximately 4% of the light is reflected at each surface. Ignoring internal multi-bounces, two bare surfaces with n = 1.50 cause a 7.84% first-pass two-surface reflection loss. Vacuum-deposited multi-layer AR coatings cut that loss below 0.5% per single surface via destructive wave cancellation.
Reflection of light follows the classical law of reflection. That is, the angle of incidence equals the angle of reflection. Both angles are measured from a line perpendicular to the optical surface, known as the surface normal. When a cover lens is smooth within nanometer tolerances, it can create a clear mirror reflection.
Unwanted ghost doubling occurs because light is reflected twice, once from the top glass face and again from the bottom interface of the air gap. Our first surface mirror reflection control guide states that to avoid secondary glass reflections in precision optics, coatings should be placed on the outer boundary. In backlit displays, however, we want to eliminate all reflected images.
Quarter-wave anti-reflective stacks use destructive interference to cancel reflected intensity at the target wavelength by forcing two reflected rays into opposite phase peaks. One ray is the internal reflection from the upper-film surface, while the other is from the lower-substrate surface. Destructive interference occurs when upper-film and lower-substrate reflections are opposite in phase and match in amplitude, canceling reflected intensity at the target wavelength. Please review how anti-reflective coatings cancel reflection across multi-layer SiO2 and TiO2 / Nb2O5 sputtered layers.
| Surface Stack | Target Incidence Angle | Single-Surface Reflectance | Typical Use Case |
|---|---|---|---|
| Uncoated Clear Glass (n = 1.5) | 0° normal | ~4.0% per face (7.84% first-pass 2-face loss) | Indoor cost-sensitive cover windows |
| Broadband VIS 0° AR Coating | 0° normal | 0.4% average (425–675 nm) | Perpendicular display and camera windows |
| Broadband VIS 45° AR Coating | 45° oblique | 0.75% average (425–675 nm) | Tilted automotive clusters and beam splitters |
| SW Glass Multi-Layer Sputtered AR | 0°–15° display view | <0.5% per single surface | High-contrast marine, medical, and outdoor HMI |
| Narrowband V-Coat AR | 0° at design wavelength | <0.25% at DWL | Single-frequency laser optics and LiDAR ports |
Published broadband AR coating specifications show that designing for a 45-degree mounting tilt shifts effective optical thickness in the film. Engineers specify viewing tilt on drawings before sputtering chambers adjust the thickness ratios of SiO2 and TiO2. If not, off-axis light will reflect more strongly and shift toward magenta or green.
Refraction, Refractive Index, and Glass Thickness: Worked Fresnel Loss Budget
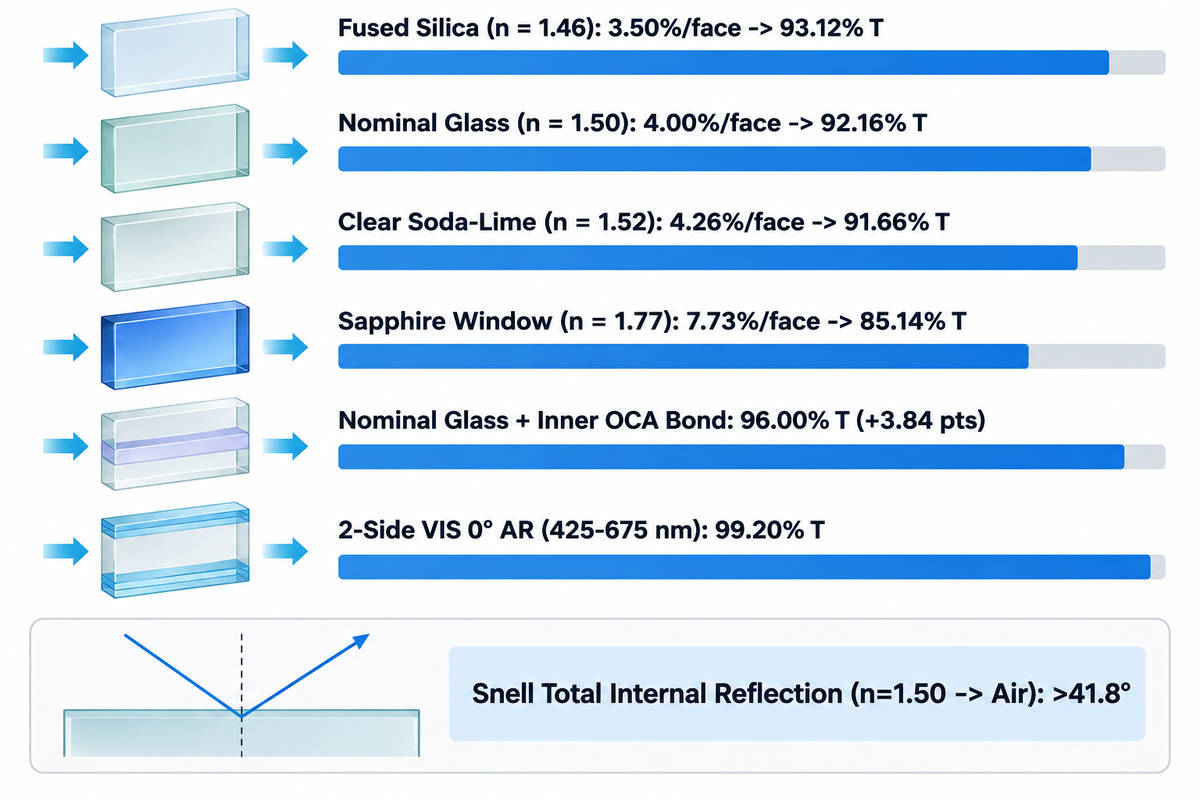
Oblique refraction bends a beam of light whenever phase speed changes across an interface with different refractive index values, while 0-degree normal rays change phase speed across any index boundary without angular bending. Normal-incidence surface reflection follows Fresnel’s equation R = ((n1 – n2)/(n1 + n2))^2, which leaves glass thickness neutral on single-face reflection, even as bulk absorption increases between 1.1 mm and 3.0 mm cover gauges. Internal angles greater than 41.8 degrees trap rays by total internal reflection inside n = 1.50 glass that meets air.
For reference, see the Fresnel Optics reference at the University of Arizona . As documented in the University of Arizona Fresnel optics reference, optical media span from vacuum (n = 1) and water (n ≈ 1.3) up to clear glass (n = 1.50) and diamond (n ≈ 2.4). The smaller the index of refraction mismatch across a boundary, the smaller the reflected light power. See our reference on refractive index matching for optical glass to find the glass melt constants for the visible region.
Snell’s law governs ray bending across every non-perpendicular surface: n1 * sin(θ1) = n2 * sin(θ2). When light travels inside n = 1.50 glass toward an outer air boundary, angles exceeding 41.8 degrees produce no real exit angle. Beyond that critical angle, rays bounce completely back into the plate and pipe stray backlight illumination to bevel edges.
Fresnel-to-Thickness Transmittance Protocol
Our Fresnel-to-Thickness Transmittance Protocol separates surface boundary reflection, substrate index step, and inner gap matching into three sequential checks. Uncoated fused silica (n = 1.46) loses 3.50% per face. Bare silica bounces > 3.5% per face, while borosilicate per face at n = 1.47 loses > 3.6% per face versus low-iron soda-lime (3.62% exact). Low-iron soda-lime (n = 1.52) exceeds > 4.3% per face near sapphire at 587.6 nm (4.26% nominal, or 4.30% at 1.5234). Sapphire per face at n = 1.77 loses > 7.7% per face plus 1.1 mm vs. 3.0 mm bulk iron-oxide attenuation and air-gap vs. OCA interface loss recovery (7.73% single-face R). Eliminating an air gap using OCA optical bonding services replaces an inner air-glass interface with an adhesive joint matched near glass index.
Assumed inputs for worked budget (Table 4): Calculations assume lossless bulk glass (zero internal absorption or scattering) so surface boundaries isolate cleanly. Air sits at n1 = 1.0, and nominal substrate indices span fused silica (1.46), borosilicate (1.47), standard glass (1.50 and 1.52), and sapphire (1.77). Coated cases use published broadband 0.4% (VIS 0°), 0.75% (VIS 45°), and 0.25% (narrowband V-coat upper limit) single-face reflectance. Optical bonding assumes clear adhesive matched to glass index eliminates inner air-glass reflection while keeping the outer boundary exposed.
| Substrate & Coating Stack | Index (n) & Active Boundaries | Single-Face Reflection (R) | Fresnel Formula | First-Pass Transmission (Excluding Multi-Bounce) |
|---|---|---|---|---|
| Fused Silica (Bare Air Gap, 0°) | n = 1.46; 2 bare faces | 3.50% per face (> 3.5% two-face sum 6.87%) | (1 – 0.0350) × (1 – 0.0350) | 93.12% |
| Borosilicate Glass (Bare Air Gap, 0°) | n = 1.47; 2 bare faces | 3.62% per face (> 3.6% per face) | (1 – 0.0362) × (1 – 0.0362) | 92.89% |
| Nominal Clear Glass (Bare Air Gap, 0°) | n = 1.50; 2 bare faces | 4.00% per face | (1 – 0.0400) × (1 – 0.0400) | 92.16% (0.9216) |
| Clear Soda-Lime (Bare Air Gap, 0°) | n = 1.52 (1.5234 at 587.6 nm); 2 bare faces | 4.26% per face (> 4.3% at n = 1.5234) | (1 – 0.0426) × (1 – 0.0426) | 91.66% |
| Sapphire Window (Bare Air Gap, 0°) | n = 1.77; 2 bare faces | 7.73% per face | (1 – 0.0773) × (1 – 0.0773) | 85.14% |
| Nominal Glass + Inner OCA Bond | n = 1.50; 1 outer air face (inner R → 0) | 4.00% outer face only | 1 – 0.0400 | 96.00% (+3.84 percentage points) |
| 2-Side VIS 0° Broadband AR (425–675 nm) | 2 AR-coated air faces | 0.40% per face | (1 – 0.0040) × (1 – 0.0040) | 99.20% |
| 2-Side VIS 45° Oblique AR (425–675 nm) | 2 oblique AR air faces | 0.75% per face | (1 – 0.0075) × (1 – 0.0075) | 98.51% |
| 2-Side Narrowband V-Coat AR (at DWL) | 2 laser AR faces | <0.25% per face | (1 – 0.0025) × (1 – 0.0025) | >99.50% at DWL |
Under these lossless-bulk inputs, eliminating the inner air gap with OCA lifts n = 1.50 first-pass boundary throughput from 92.16% to 96.00% (+3.84 percentage points). A 2-side VIS 0° AR stack raises that single-pass interface throughput to 99.20%. This budget isolates interface losses rather than serving as a final transmittance datasheet. Multiple internal bounces add slightly to total transmission, while trace iron impurities, glass thickness (1.1 mm vs. 3.0 mm or 6 mm), and polarizer films add absorption. Replacing an air gap with optical bonding cement also shifts multi-layer interference center wavelengths, so cemented stacks require re-tuned coatings.
Light Absorption vs. Scattering: Separating Heat Buildup from Surface Haze
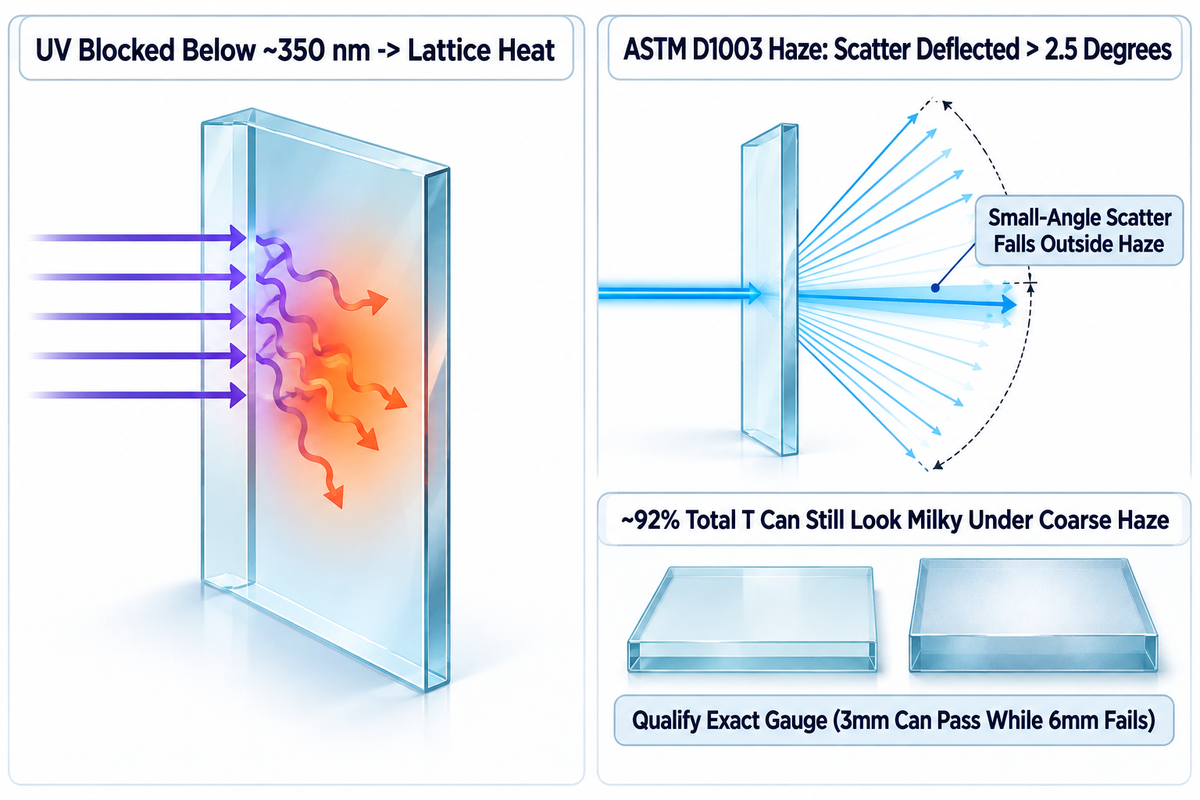
Absorption removes energy from an incident light beam and transforms photon energy into either electronic or lattice excitations within the glass bulk. Scattering redirects transmitted rays across narrow forward angles or wide angles beyond 2.5 degrees off-axis, creating milky haze under ASTM D1003. Glass Precision’s engineering guide lists haze targets below 0.3% for aerospace optics, below 0.5% for medical optics, and 0.5% to 1% for consumer display glass. Too much AG scattering leads to higher backlight levels without restoring sharp image contrast.
What is light absorption in optical glass, and why does glass block UV light?
Light absorption happens when a photon matching a transition energy gap is absorbed by an electron rather than transmitted. Per Vanderbilt optical glass transmission data, silicate substrates strongly block deep ultraviolet radiation below roughly 350 nm. Meanwhile, trace iron oxides inside standard soda-lime glass absorb part of the blue light spectrum and near-infrared band. RefractiveIndex.info records a low soda-lime extinction coefficient of k = 3.8974e-7 (absorption coefficient alpha = 0.083350 cm^-1) at 587.6 nm.
Unlike specialty optical glasses doped for fluorescence or phosphorescence, undoped cover glass converts absorbed UV energy directly into lattice heat. Elevated temperatures in enclosed outdoor kiosks can cause LCD blackening and accelerate adhesive yellowing, while surface reflections reduce visible contrast. Analyzing low-iron vs. clear soda-lime glass absorption helps forecast green edge shift in thick touch windows.
ASTM D1003 defines wide-angle transmission scattering as haze: the fraction of transmitted light deflected by more than 2.5 degrees from the incident direction; smaller angle scattering is outside the haze measurement. A glass sheet can transmit ~92% of total light but still appear milky when surface haze is high.
Validating a haze specification on a 3mm sample can qualify material that fails when the final assembly uses 6mm glass, because bulk inclusion scatter accumulates through the thicker optical path. Lock coupon tests to the exact production gauge before cutting hard tooling.
Diffraction, Thin-Film Interference, Dispersion, and Polarization on Displays
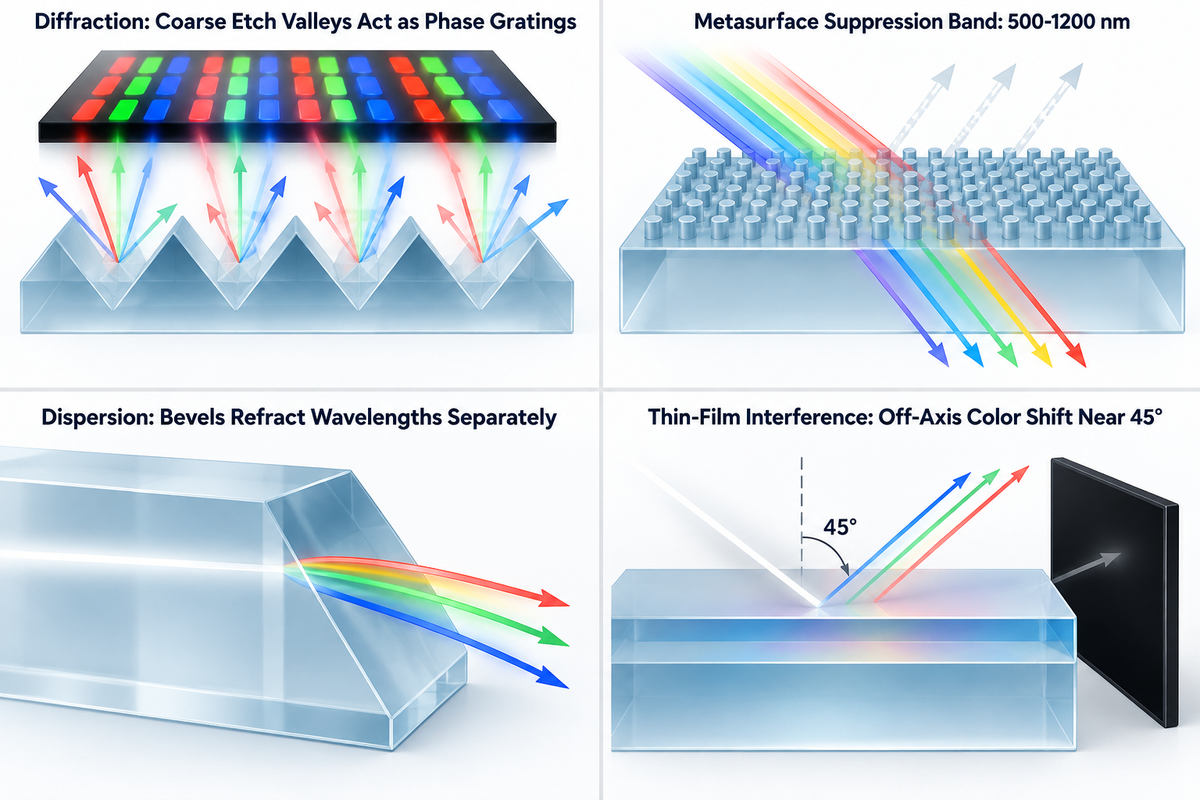
Modern displays can reveal artifacts invisible with ray tracing. Diffraction splits pixels against sub-micron surface grids, dispersion spreads white light through thick bevel edges, and thin-film interference produces off-axis color shift near 45 degrees. Stress birefringence rotates output, creating dark spots when viewed with polarized eyewear.
Diffraction gets light waves to bend around microscopic apertures and anti-glare edges. With sufficiently coherent illumination, this can produce an interference pattern across subpixels. As pixel densities increase on handheld displays, coarse random etch valleys function as phase gratings. These local phase differences create sparkling hues of red, green and blue that negatively affect image quality and perception of depth.
Research reported by Photonics Spectra on metasurface coatings shows sub-wavelength surface patterns that suppress reflection across 500–1200 nm and at steep angles. Until nanostructured films scale economically to large cover-glass sheets, standard multi-layer sputtered coatings remain sensitive to viewing angle.
When white light strikes beveled edges or thick glass at steep angles, different wavelengths refract at slightly different angles, just like a classic prism. Controlling optical dispersion and Abbe number limits chromatic fringing around high-contrast icons. Tuning thin-film interference filters allows us to isolate narrow-band LiDAR and sensor signals from other visible wavelengths.
Anti-Reflective (AR) Coating vs. Etched Anti-Glare (AG) Glass for Controlling Glare
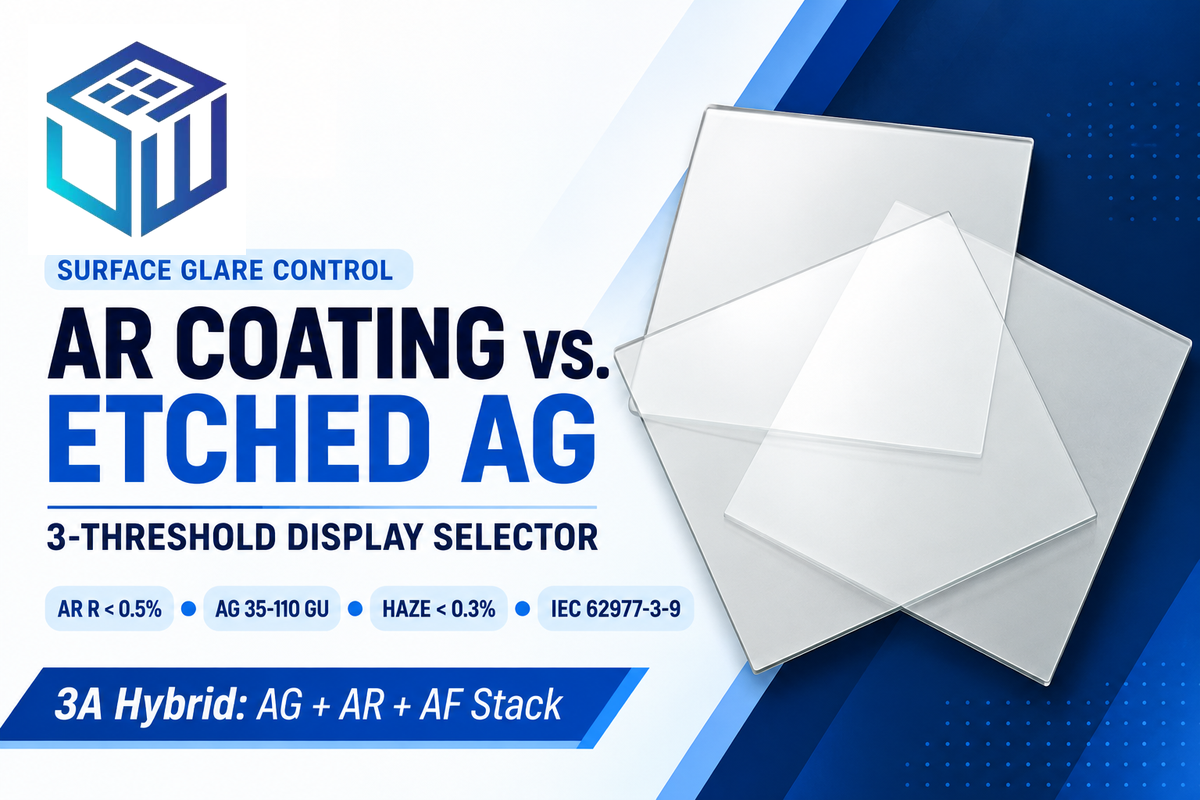
3-Threshold AR-vs-AG Surface Selector
Our 3-Threshold AR-vs-AG Surface Selector takes into account specular reflectance, 60-degree gloss (GU), and ASTM D1003 haze together. Multi-layer AR coatings can cut front reflection below 0.5% per single surface to boost outdoor screen readability. Uncoated smooth glass approaches roughly 100 GU on a 60-degree black-glass glossmeter scale, whereas CNGlassFab reports that controlled chemical etching tunes diffuse 60-degree gloss across 35 to 110 GU. Oily fingerprints can alter the local interference conditions of AR coatings and increase reflection. Sealing etched valleys with an oleophobic AF topcoat prevents skin oils from altering AG scattering.
Ambient luminance means that high-brightness LEDs can’t completely solve outdoor readability on their own. At 0° normal incidence, an untreated air-glass boundary reflects about 4% on each side; thus, under 100,000 lux direct sunlight, there’s direct reflected glare, which degrades bright-screen visibility even on a 2,500-nit panel. Per Edmund Optics broadband visible specifications, a 425–675 nm VIS 0° AR coating lowers single-surface reflectance to 0.4% average, cutting reflected interference sharply. As a result, reflected interference is significantly reduced.
Where bright indoor overhead bulbs cast sharp mirror images onto control panels, engineers pair etched AG glass (35 to 110 GU at 60°) with fine-pitch surface control. Match the etch structure to pixel pitch on high-resolution displays to reduce sparkle, as quantified by IEC 62977-3-9 display sparkle contrast testing and patent metrology guidelines. For chemical wipe-downs, etched AG glass holds up better than sprayed AG silica.
High-reliability human-machine interfaces often combine all three treatments: etched front AG microtexture, vacuum-sputtered AR multilayers, and an outer hydrophobic AF topcoat. For SW Glass, review their vacuum-sputtered AR and AF coating capabilities and chemically etched AG glass specifications to set the proper balance between sparkle and washout.
| Application Environment | Recommended Surface | Gloss (60° GU) | Target Reflectance / Haze | Boundary / Failure Limit |
|---|---|---|---|---|
| Direct Sunlight Marine / EV Console | 2-Side AR + AF + OCA Bond | Specular finish | Single-face R < 0.5% (2-side < 1%); Haze < 0.3% | Oily smudges form air-oil boundary without AF topcoat |
| Overhead-Lit Hospital Monitor | Chemically Etched AG + AF | 35–110 GU at 60° (CNGlassFab) | Diffuse haze tuned by etch depth (match to PPI) | Sprayed AG degrades faster under alcohol wipes |
| High-Brightness Factory HMI | 3A Hybrid (AG + AR + AF) | 35–110 GU at 60° (controlled diffuse) | Single-face R < 0.7% (SW Glass 3A spec); AG haze tuned by PPI | Adds sputtering + etching batch cost |
| High-PPI Handheld OLED Display | Fine-Etch AG or AR | 35–100 GU at 60° (AG) or Specular AR | AR haze < 1% (GlassPrecision); AG matched to PPI | Coarse low-GU etch valleys trigger pixel sparkle |
| Machine Vision / Barcode Scanner | Broadband VIS 0° AR | Specular AR finish (low haze) | R <= 0.4%; Haze < 0.3% | Coarse AG scatter near finite lens working distances can soften edge focus |
| 45°-Tilted HUD / Avionics Bezel | Angle-Tuned VIS 45° AR | Specular AR finish | Single-face R <= 0.75% at 45° | 0°-tuned AR shifts purple/green at 45° |
| Laser Rangefinder / Narrow Emitter | DWL V-Coat AR | Specular AR finish | Single-face R < 0.25% at DWL | Reflectance climbs steeply off center wavelength |
| Heavy Industrial 10–15″ Panel (Matt) | Moderate Etched AG (35–110 GU at 60°) | 35–110 GU at 60° | Diffuse scatter tuned by etch gloss | Excess diffuse texture lowers direct display crispness |
| Indoor Entry-Level Appliance Display | Uncoated Chemically Strengthened | Specular uncoated float | 92.16% first-pass ceiling; 7.84% 2-face R | ~7.84% first-pass 2-face loss lowers bright-ambient contrast |
Custom AR and AG Cover Glass Cost Drivers, MOQs, and Lead Times
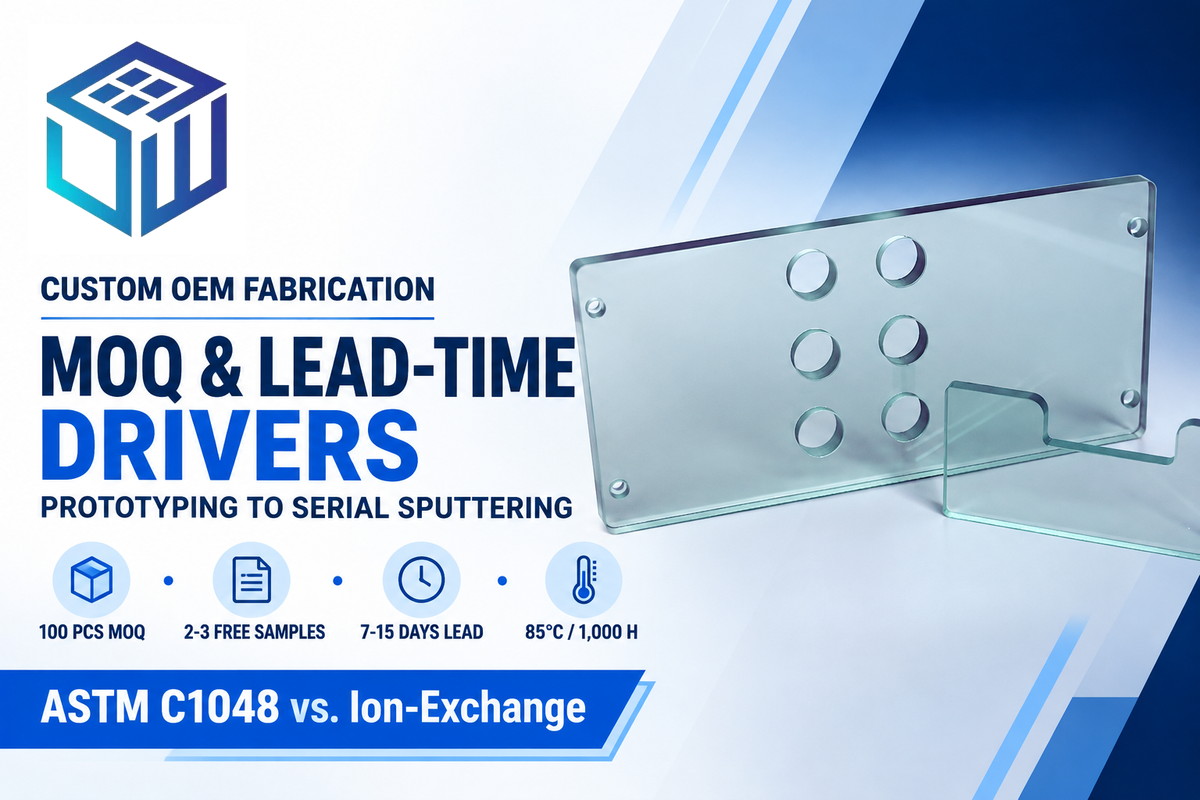
SW Glass sets production MOQs starting at 100 pieces with 2–3 free prototype samples, shipping standard custom orders in 7–15 days (or 5–7 days rush). Unit pricing is quoted directly based on an RFQ because catalog rates aren’t published. Substrate alloy, double-side vacuum sputtering, chemical strengthening, silk-screening, and setup NRE affect the final price.
Vacuum-sputtered AR coatings are more expensive than bare etched glass because chamber pump-down cycles (<10^-3 Pa), multi-target deposition (SiO2/TiO2), and double-side rack flips reduce batch throughput. Choosing two-side AR coatings doubles coating cycle steps compared to front-face-only deposition. Meanwhile, chemically strengthened cover glass panels gain surface compression during the potassium-nitrate ion-exchange process. Note that the ≥69 MPa (10,000 psi) threshold in ASTM C1048 covers thermally tempered flat glass rather than chemically strengthened glass.
Environmental qualification tests assess the durability of multi-layer stacks through standardized accelerated tests. SW Glass magnetron-sputtered AR specifications state that it passes salt spray exposure, 1,000 hours at 85°C / 85% RH damp heat, and 500 hours of UV aging.
| Manufacturing Factor | Typical SW Glass Baseline | How Spec Choice Shifts Quote & Schedule |
|---|---|---|
| Prototyping & MOQ | 2–3 free samples; 100 pcs MOQ | Avoids legacy 500–1,000 pc vacuum batch minimums |
| Production Lead Time | 7–15 days (5–7 days rush) | Multi-color ceramic silk-screen + 2-side AR adds fixture passes |
| Coating Architecture | Single-layer (<2% single-face R) or multi-layer (<0.5% single-face R) | Double-side broadband AR doubles chamber run time vs. 1-side |
| Environmental Qualification | Tested per SW Glass spec: 85°C/85%RH 1,000 h; 500 h UV; salt spray | Durability evaluation for the tested SW Glass product |
Qualifying Optical Cover Glass OEM Manufacturers and RFQ Drawing Specs
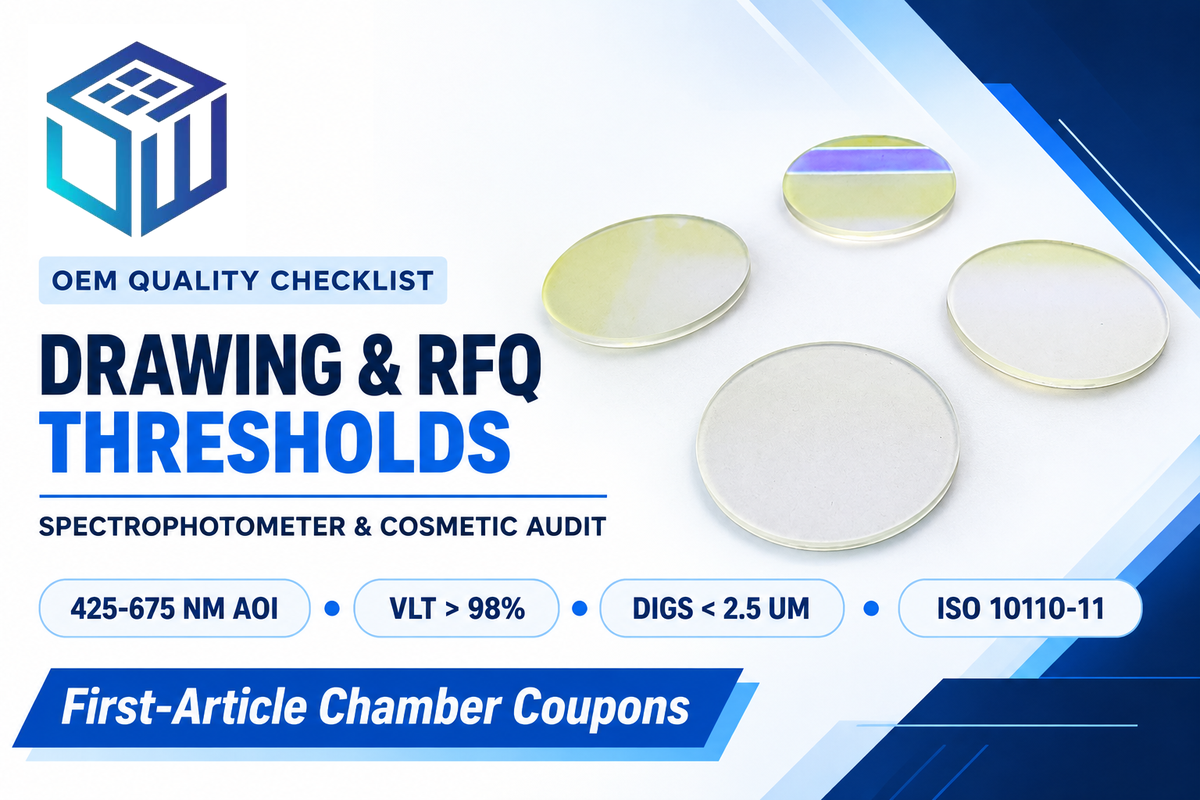
Buyers examine vacuum sputtering and cleanroom CNC edge precision in-house rather than distributor markups to qualify optical finishers. Request Konica Minolta spectrophotometric transmittance (>98% VLT), single-face reflectance (<0.5% R), and 60-degree gloss lot reports. Compared with ASME Y14.18M, which defines optical tolerances, surface quality requirements, material specifications, and coating requirements, ISO 10110 sees broader global adoption. Lock wavelength bands, incidence angles, ISO 10110-11:2025 defaults, and MIL-PRF-13830B defect limits before tooling begins.
Primary melt producers such as Corning, SCHOTT, and AGC supply raw sheet glass, whereas integrated optical finishers machine profiles, ion-exchange strengthen substrates, etch AG textures, and sputter AR/AF stacks. During an audit, an OEM confirms whether coating and tempering happen under one roof or depend on third-party coaters. Check out SW Glass custom optical glass solutions, in addition to CNC and coated cover-glass traceability specs.
Copy this verification table into your RFQ drawing package to help suppliers quote using the same acceptance thresholds.
RFQ checklist — copy these into your quote request:
| Parameter | Recommended range | Why it matters | How to verify |
|---|---|---|---|
| Wavelength Band & Incidence Angle | 425–675 nm at 0° or 45° | Prevents purple or green shift when displays mount tilted | Check spectrophotometer R/T curve at design AOI |
| Visible Transmittance & Reflectance | VLT >98% (2-side AR window); R <0.5% single face (SW Glass AR spec) | Maximizes daylight screen contrast and sensor SNR | Dual-beam Konica Minolta lot scan report |
| 60° Gloss & Transmission Haze | Specular AR (low transmission haze in GlassPrecision specifications) OR Etched AG (35–110 GU at 60°; haze per supplier spec) | Balances overhead glare reduction with target display sharpness | 60° glossmeter plus ASTM D1003 haze reading |
| Surface Cosmetics (MIL-PRF-13830B) | Digs <2.5 μm ignored per MIL-PRF-13830B | Eliminates subjective visual inspection disputes | Dark-box inspection against calibrated dig reticle |
| Implicit Drawing Tolerances | ISO 10110-11:2025 defaults; explicit base wavelength if fringes used | Sets unambiguous edge chip, bubble, and surface form limits | Cite ISO 10110-5 / -11 in drawing title block |
| Thermal Tempering (ASTM C1048) vs. Ion-Exchange Stress | ≥69 MPa (10,000 psi) for thermal tempering; specify ion-exchange DoL/CS separately | Quantifies strengthening control alongside separate impact tests | FSM surface stress meter & ring-on-ring test |
Have all finalists provide first-article coupons cut and strengthened in the same thickness, then coated in the exact production chamber planned for serial runs.
Industry Outlook: 2026 Optical Standards and High-PPI Display Tolerances
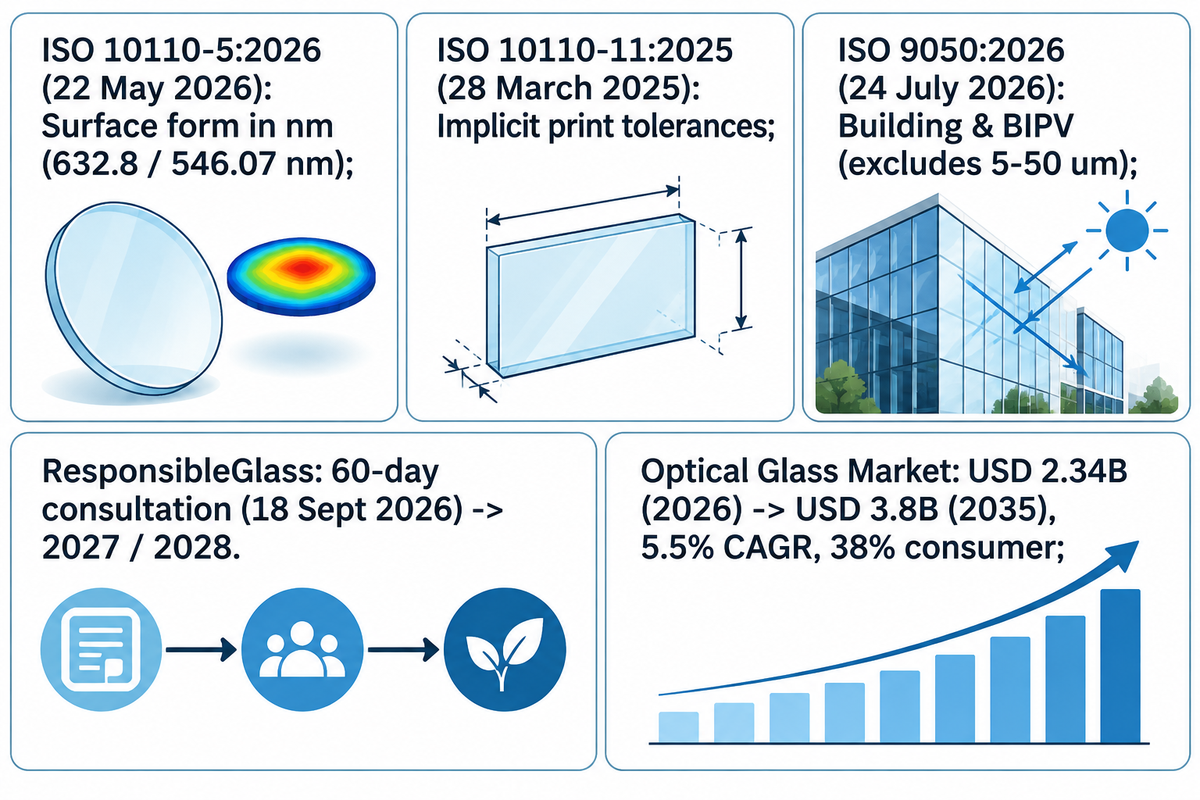
Optical cover glass drawings are moving away from unreferenced fringe counts to definite nanometers and display-specific sparkle limits. The global optical glass market is projected to rise from USD 2.34 billion in 2026 to USD 3.8 billion by 2035 (5.5% CAGR), led by a 38% consumer optics demand share.
Updated ISO 10110-5:2026 (Fourth Edition, 22 May 2026) changed the preferred unit for surface form deviations from fringe spacings to nanometres. Any fringe tolerance must cite a reference wavelength such as 632.8 nm or 546.07 nm. Companion standard ISO 10110-11:2025 (28 March 2025) updates default (implicit) tolerances for indication on prints.
Do not apply ISO 9050:2026 (Edition 3, 24 July 2026) to angled displays or sensor optics. That glazing standard is used to perform energy calculations for the lighting, heating, and cooling for a room and allows a comparison between different types of glazing including BIPV glazing. It omits the 5 μm to 50 μm band. For display anti-glare qualification, pair ASTM D1003 haze checks with IEC 62977-3-9:2023 sparkle evaluation.
There are increasing supply-chain sustainability audits related to optical glass sourcing. ResponsibleGlass opened a 60-day global consultation on 18 September 2026 toward the 2027 standard launch and first certifications in 2028.
| Standard / Benchmark | Edition / Publication Date | Published Scope & Key Parameters |
|---|---|---|
| ISO 10110-5:2026 (Edition 4) | 22 May 2026 | Surface form in nanometres; fringes require a base wavelength such as 632.8 nm or 546.07 nm |
| ISO 10110-11:2025 | 28 March 2025 | Default (implicit) tolerances for non-toleranced print dimensions |
| ISO 9050:2026 (Edition 3) | 24 July 2026 | Building & BIPV glazing (normal incidence); excludes 5 μm–50 μm band |
| Global Optical Glass Market | 2026–2035 (Business Research Insights) | USD 2.34B (2026) → USD 3.8B (2035), 5.5% CAGR; 38% consumer optics |
| ResponsibleGlass Standard | 18 September 2026 consultation | 60-day global consultation ahead of 2027 launch and 2028 initial certification |
Frequently Asked Questions About Light Behaviors in Optical Glass
Q: How do light waves travel through glass without changing direction inside a flat plate?
Light waves pass through a flat parallel plate of glass because the bending of opposing rays due to air-glass refractions cancels out. Rays emerge parallel to the incoming rays when the polished glass faces are parallel and the medium is the same on both sides.
Entering a flat parallel glass plate from air slows the wavefront and can change its angle according to Snell’s law; exiting back into air restores the original speed and angle. Permanent deviation from the path happens only with non-parallel wedges or surface waviness.
Q: What is the reflection of light in uncoated optical glass, and why is it near 8%?
Uncoated glass near refractive index 1.50 experiences approximately a 7.84% first-pass loss at 0° normal incidence, because each air-glass boundary reflects roughly 4%. For the entire window, the near 8% loss is due to the two surface reflections.
Fresnel reflections act symmetrically at both the front face (air entering glass) and the rear face (glass exiting air). Using vacuum AR coatings on both sides gets that total loss to under 1%.
Q: What does critical angle mean for total internal reflection in optical glass?
The critical angle is 41.8 degrees (standard n = 1.50 glass meeting air), marking where internal rays stop exiting completely.
Above 41.8 degrees, rays can’t satisfy Snell’s law in air and reflect totally back inside glass. Touch-display and light-guide designers keep rays from signal emitters below this angle unless waveguiding is intended.
Q: Does chemically tempering glass change its refractive index?
Yes, potassium ion exchange increases the refractive index in the outer compressive layer through ion exchange. The bulk substrate isn’t altered by this process.
Surface compressive stress develops stress-optic birefringence measured with prism-coupling FSM meters while the ion-exchange gradient remains across micrometers of outer glass depth and doesn’t alter the bulk index.
Q: Can you combine AR coating and AG etching on the same display cover glass?
Yes, integrated finishers often sputter multi-layer AR coatings on chemically etched AG glass and top it off with AF oleophobic protection.
This 3A stack brings single-face glare down below 0.7% reflectance as per SW Glass spec while diffusing overhead bulb reflections. Specify fine-etch gloss toward the upper end of the 35-100 GU etched AG band at 60° on high PPI panels to lessen sparkle.
Q: How do engineers verify visible light transmittance and surface defects during incoming cover glass QC?
Incoming quality teams use a spectral transmittance analysis across 400-700 nm with a dual beam spectrophotometer. They weight those scans with the standard photopic luminous efficiency function under an illuminant such as D65 to calculate transmittance for visible light. Other tests measure haze under ASTM D1003 and gloss at 60 degrees, and inspect surface defects under MIL-PRF-13830B.
Sampling bare glass coupons before coating catches substrate melt shifts early, while dark-box visual inspections enforce cosmetic thresholds (ignoring digs under 2.5 μm) across each sputtered lot. First-article inspections can include Konica Minolta spectrophotometric scan curves and an environmental salt-spray test.
Our Perspective
Balancing light behaviors on display cover glass comes down to the Fresnel reflection budget and the anti-glare vs. anti-reflective trade-off, and stating both clearly on drawings prevents costly prototype delays. The worked optical budget and ISO tolerances above reflect production testing workflows used on sputtered AR and etched AG panels. Reviewed by the Dongguan Saiwei Glass Co., Ltd. technical team.
Learn More About Custom Cover Glass Optical Specs →
References & Sources
- Electromagnetic Optics Basics (TN2421 Chapter 1) Delft University of Technology (TU Delft)
- Fresnel Reflection & Lens Transmission Module 3 Vanderbilt University
- Antireflective & Hard-Coated Optical Lenses (Peer-Reviewed Article archived on PubMed Central, PMC9716534) National Library of Medicine
- Fresnel Equations and Refractive Indices Reference University of Arizona Wyant College of Optical Sciences
- AI-Aided Approach Yields Metasurface-Based AR Coatings Photonics Spectra
- ISO 10110-5:2026 Surface Form Tolerances (Edition 4) International Organization for Standardization (ISO)
- ISO 9050:2026 Glass in Building Optical Determination International Organization for Standardization (ISO)
- IEC 62977-3-9:2023 Electronic Displays Sparkle Evaluation International Electrotechnical Commission (IEC)